Taking Stock: Early February 2021
Pick of the stocks this week is telkom. Chart looks incredible. Otherwise markets seem to be on the up all round. Except for palladium and dollar index.

Market Mood
FOREX:USDZAR (USDZAR)
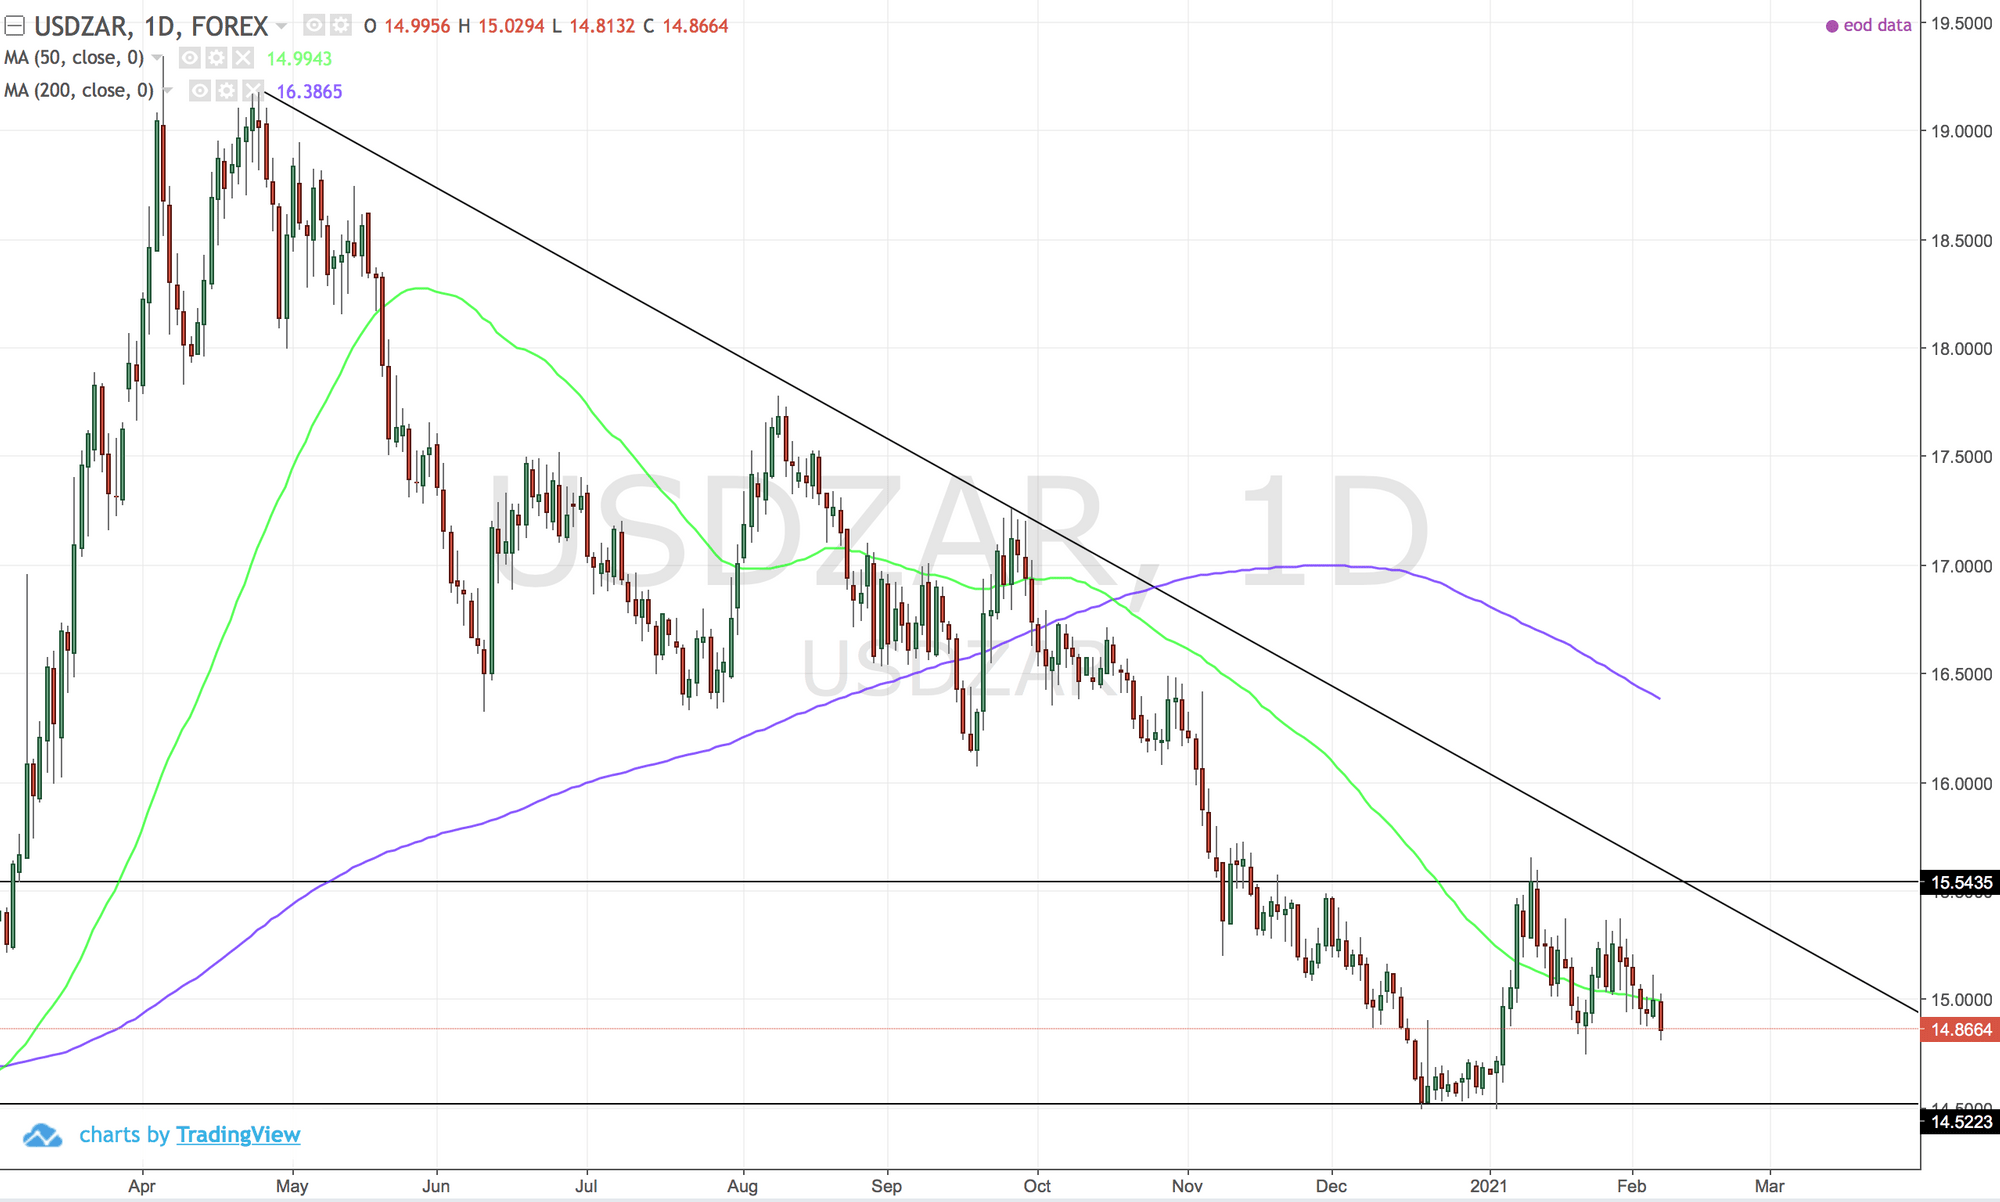
Well and truly trending down. Looking highly likely that the next stop is 14.50.
INDX:DXY (Dollar Index)
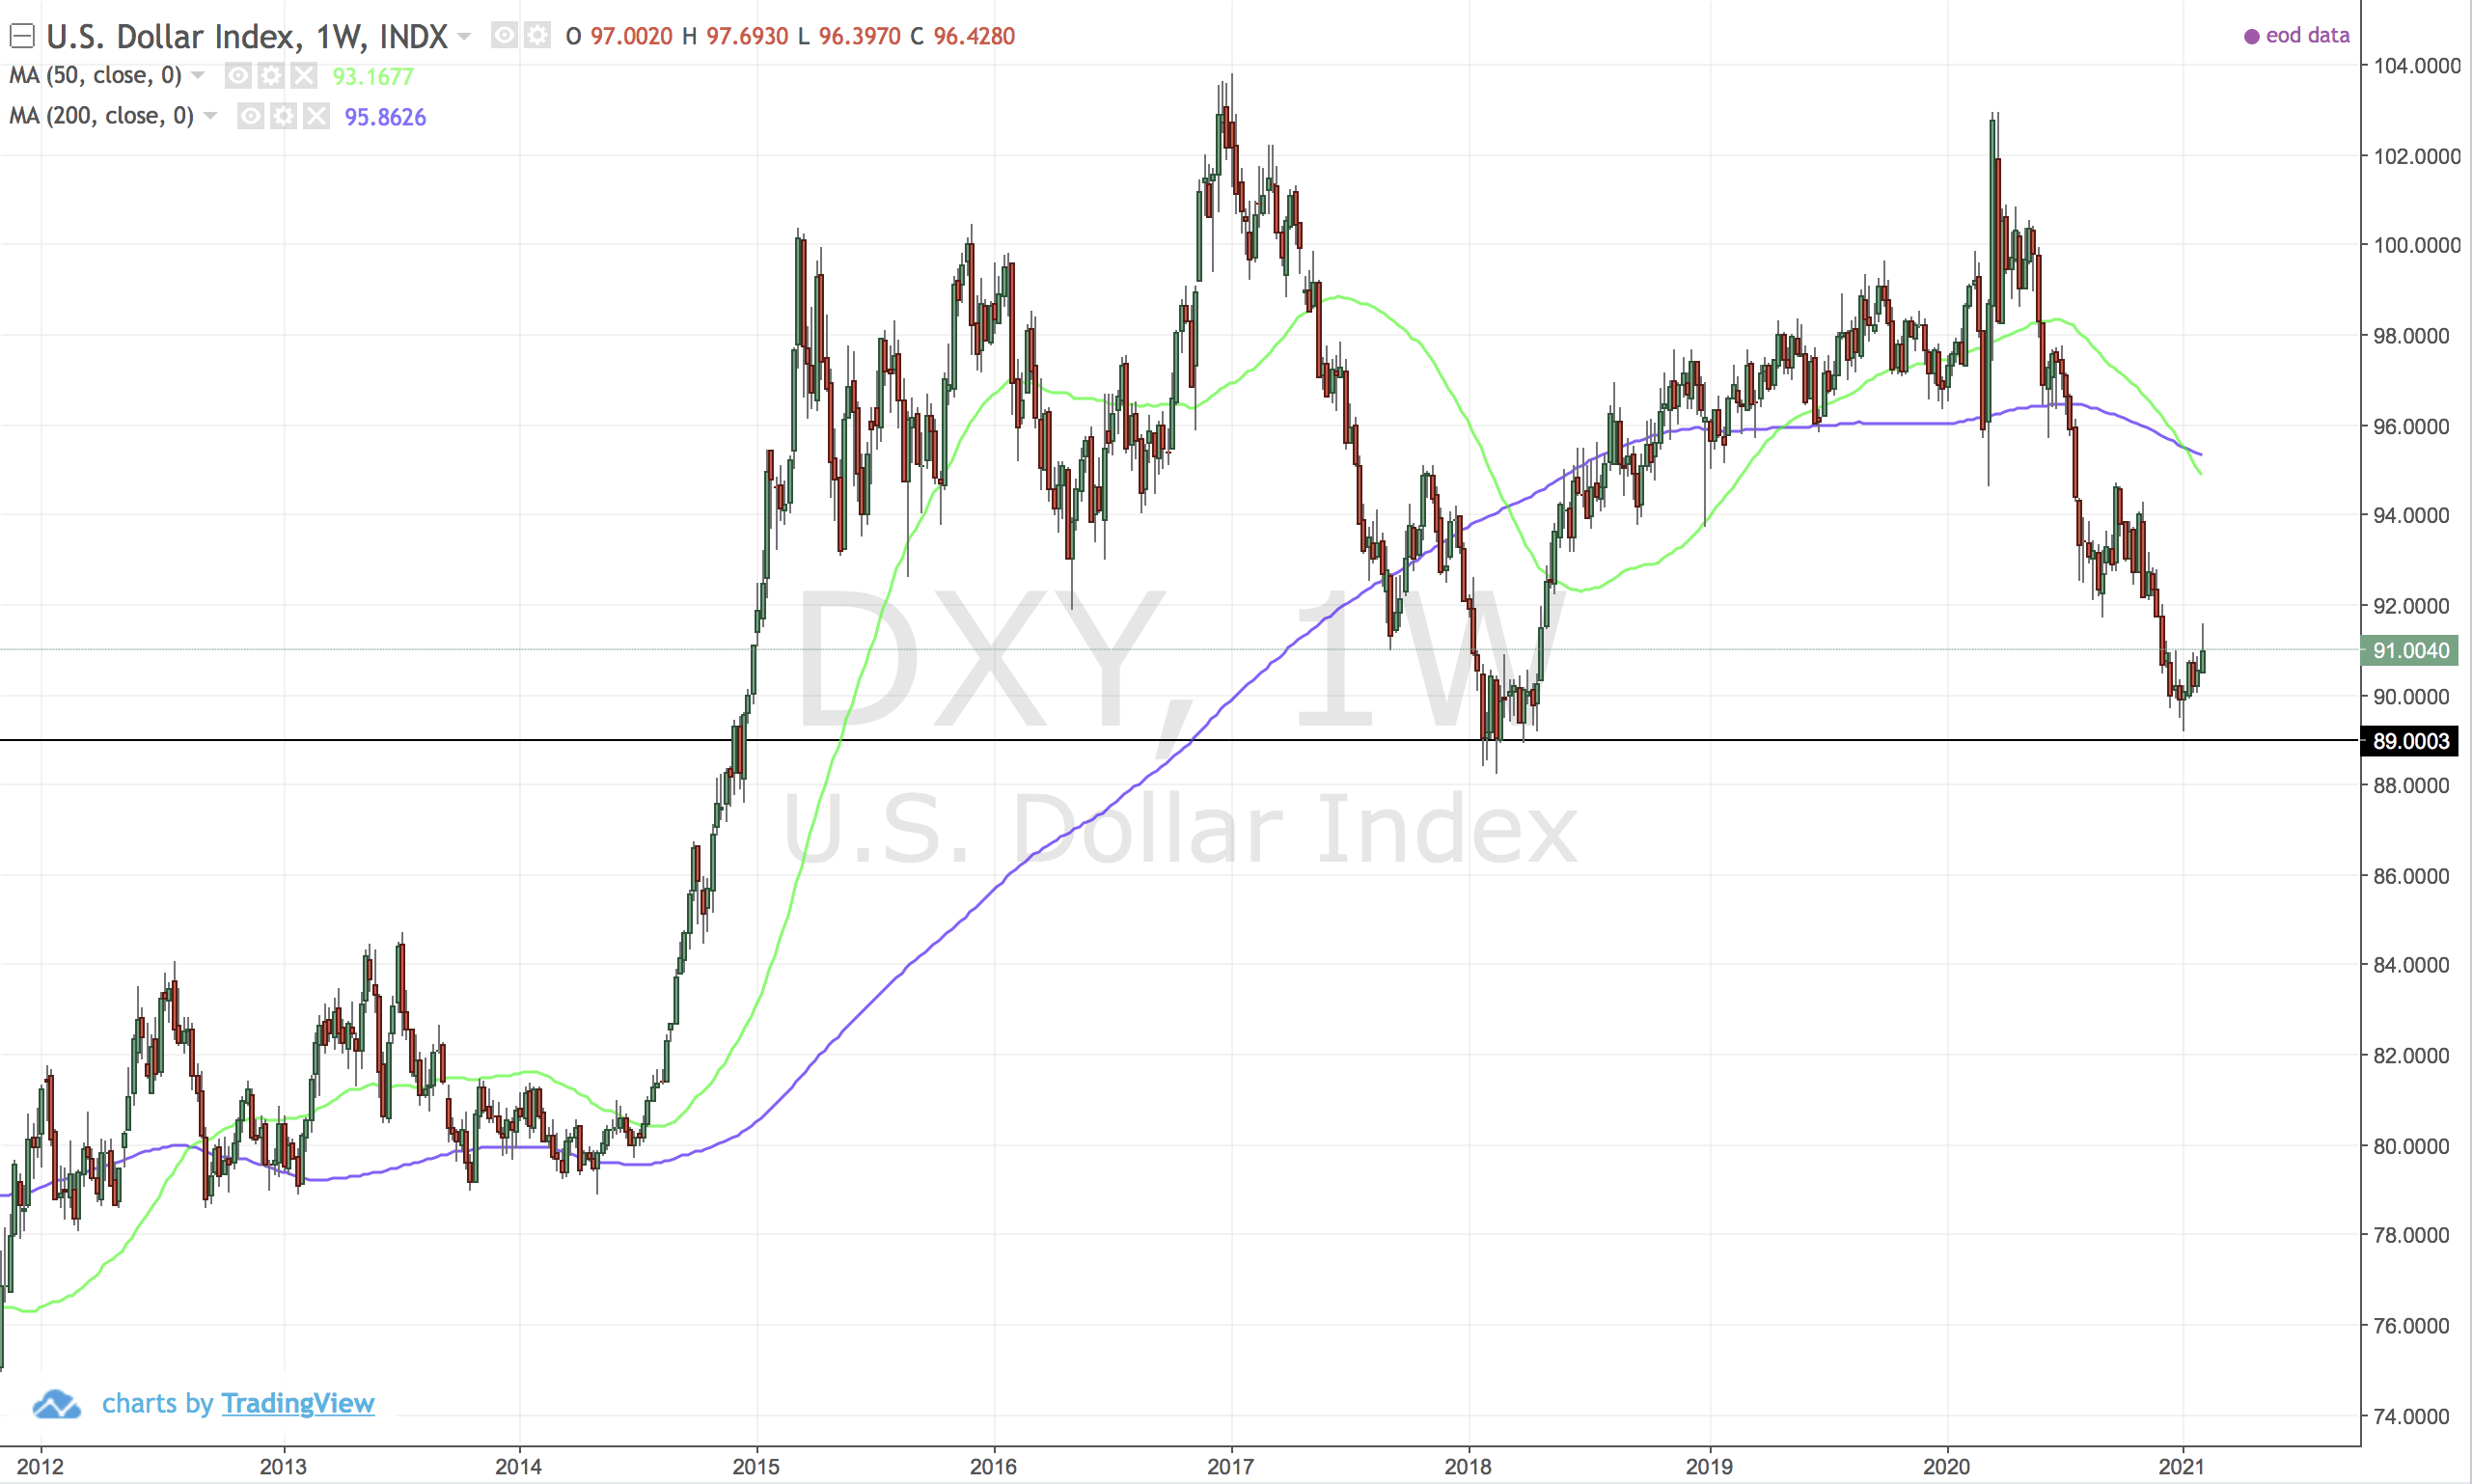
Weekly chart here. The dollar is showing a double top and trending down. Both moving averages are pointing down. Might be KO for king dollar but as always be careful forex and commodities can turn on a dime.
FOREX:EURZAR (EURZAR)
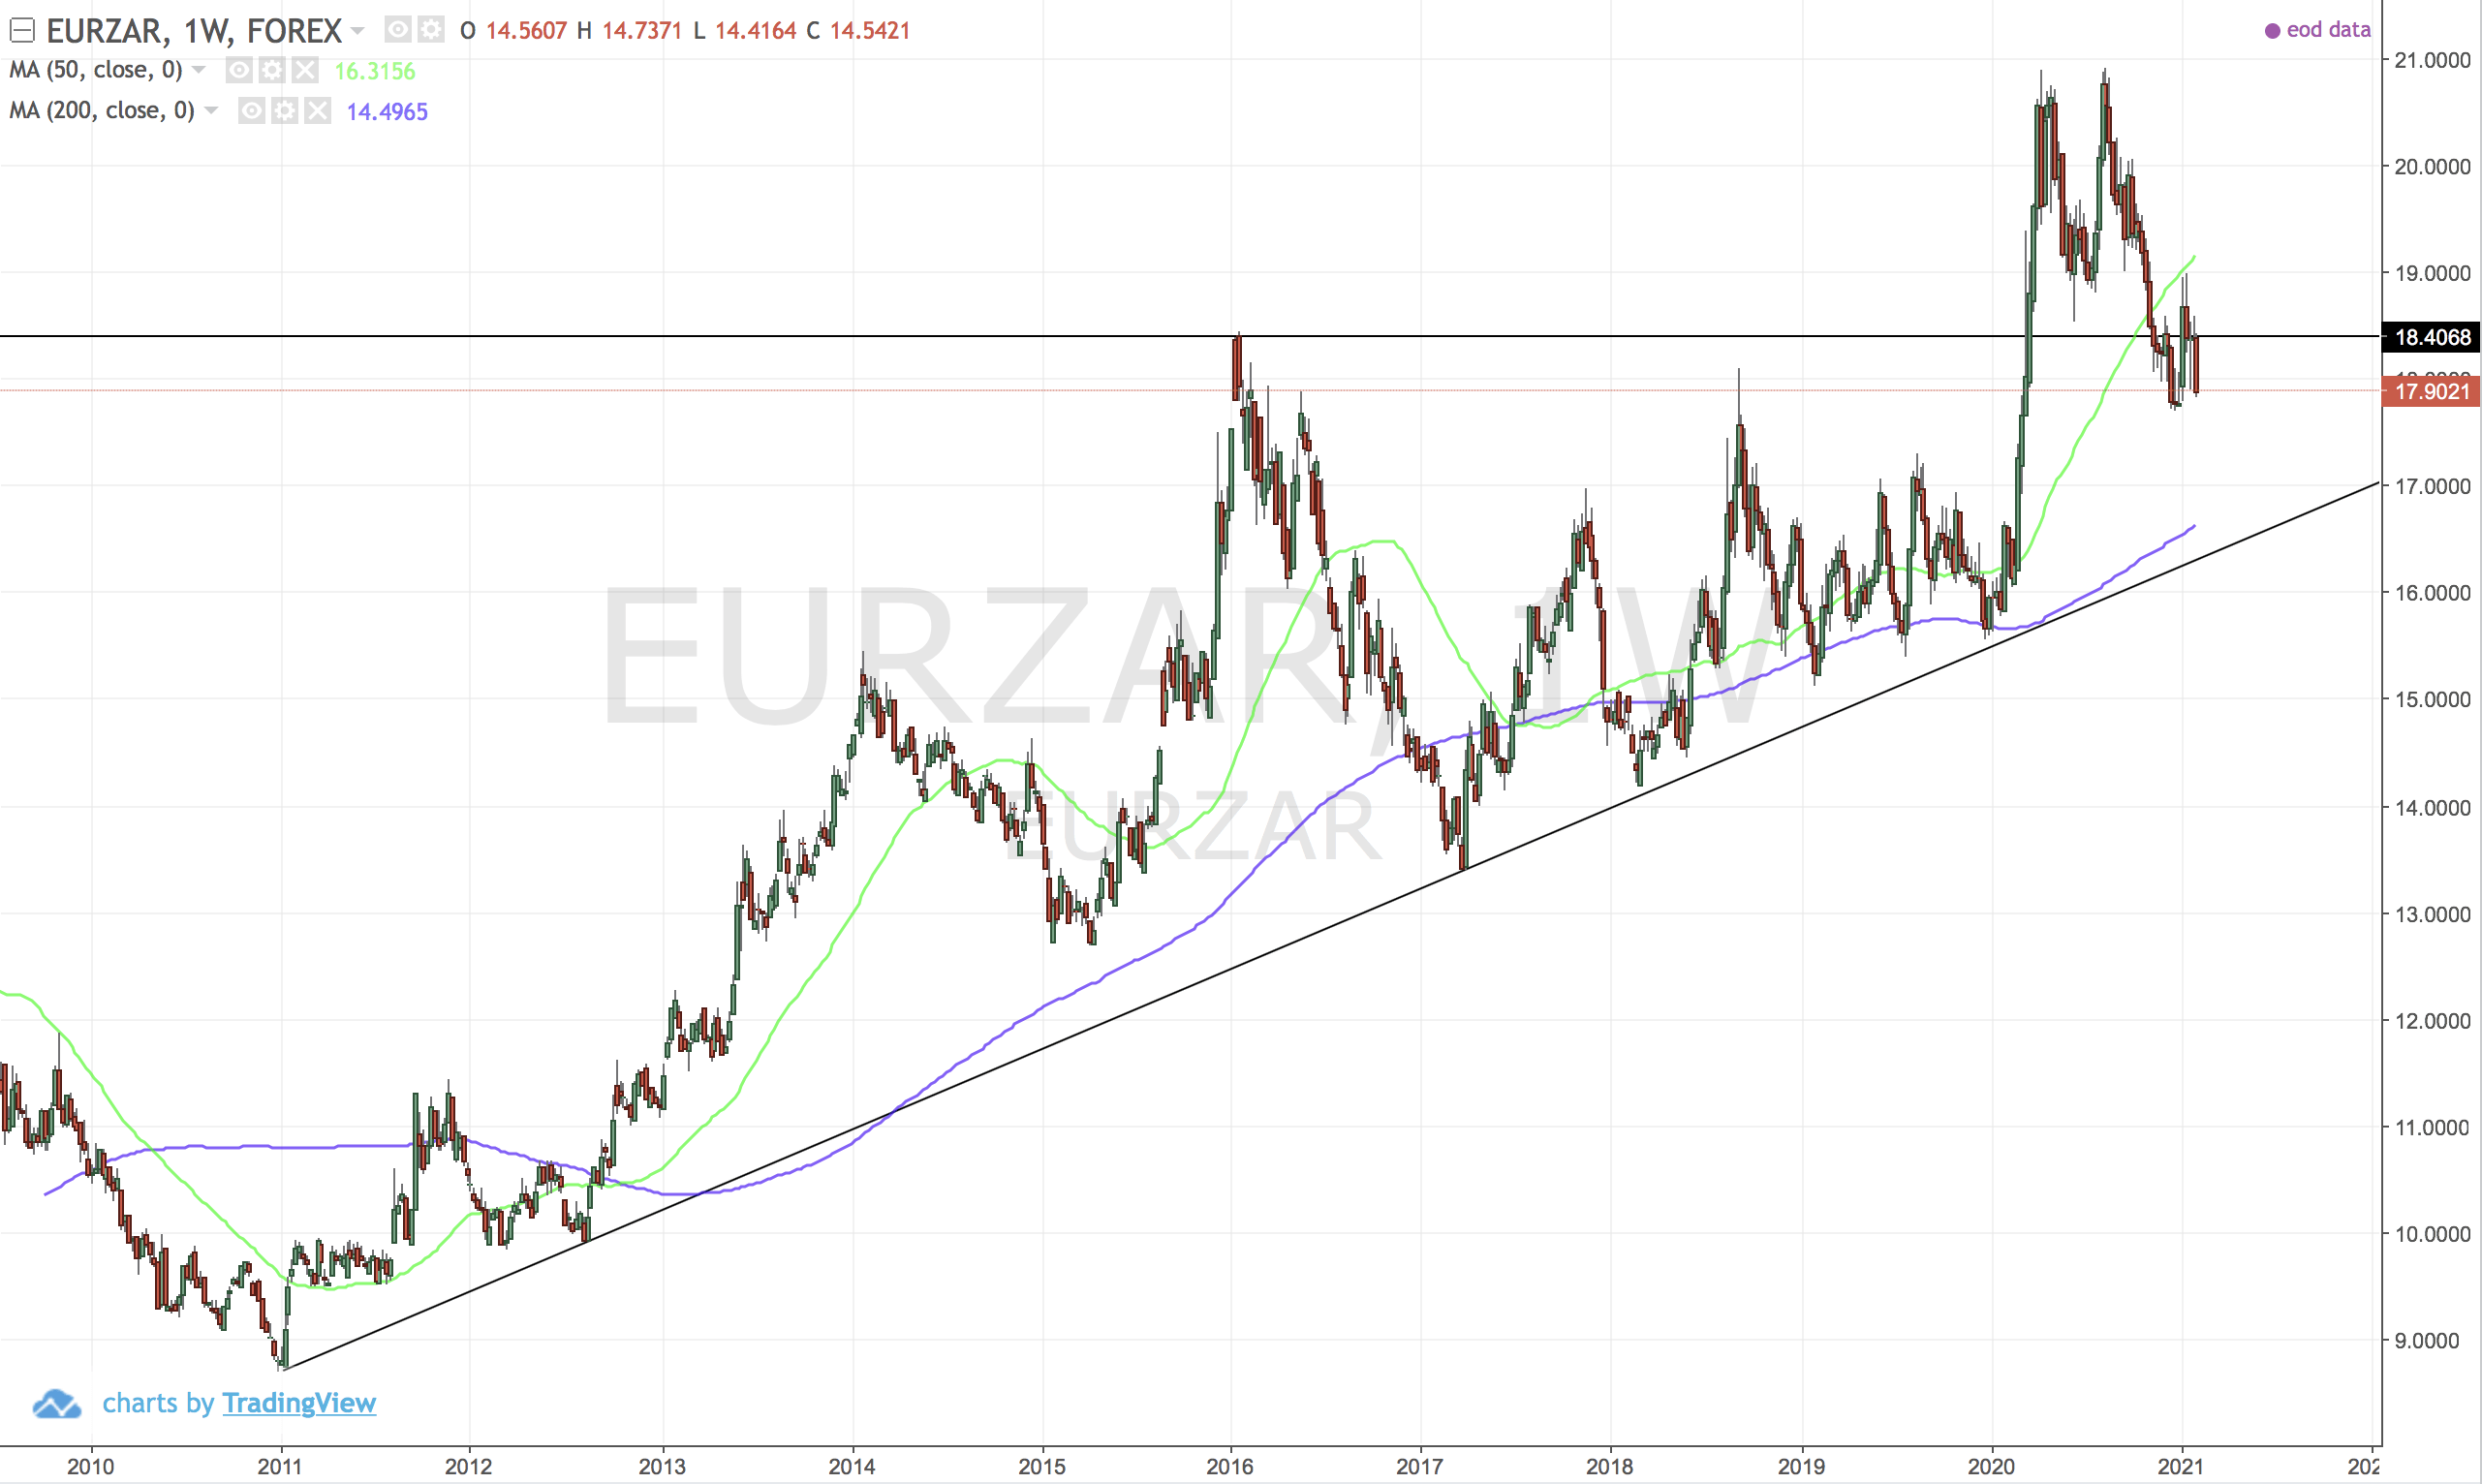
On the weekly chart. Trending up. Would only worry below 17. Similar story with FOREX:GBPZAR below 19.
CC:BTC-USD (Bitcoin)
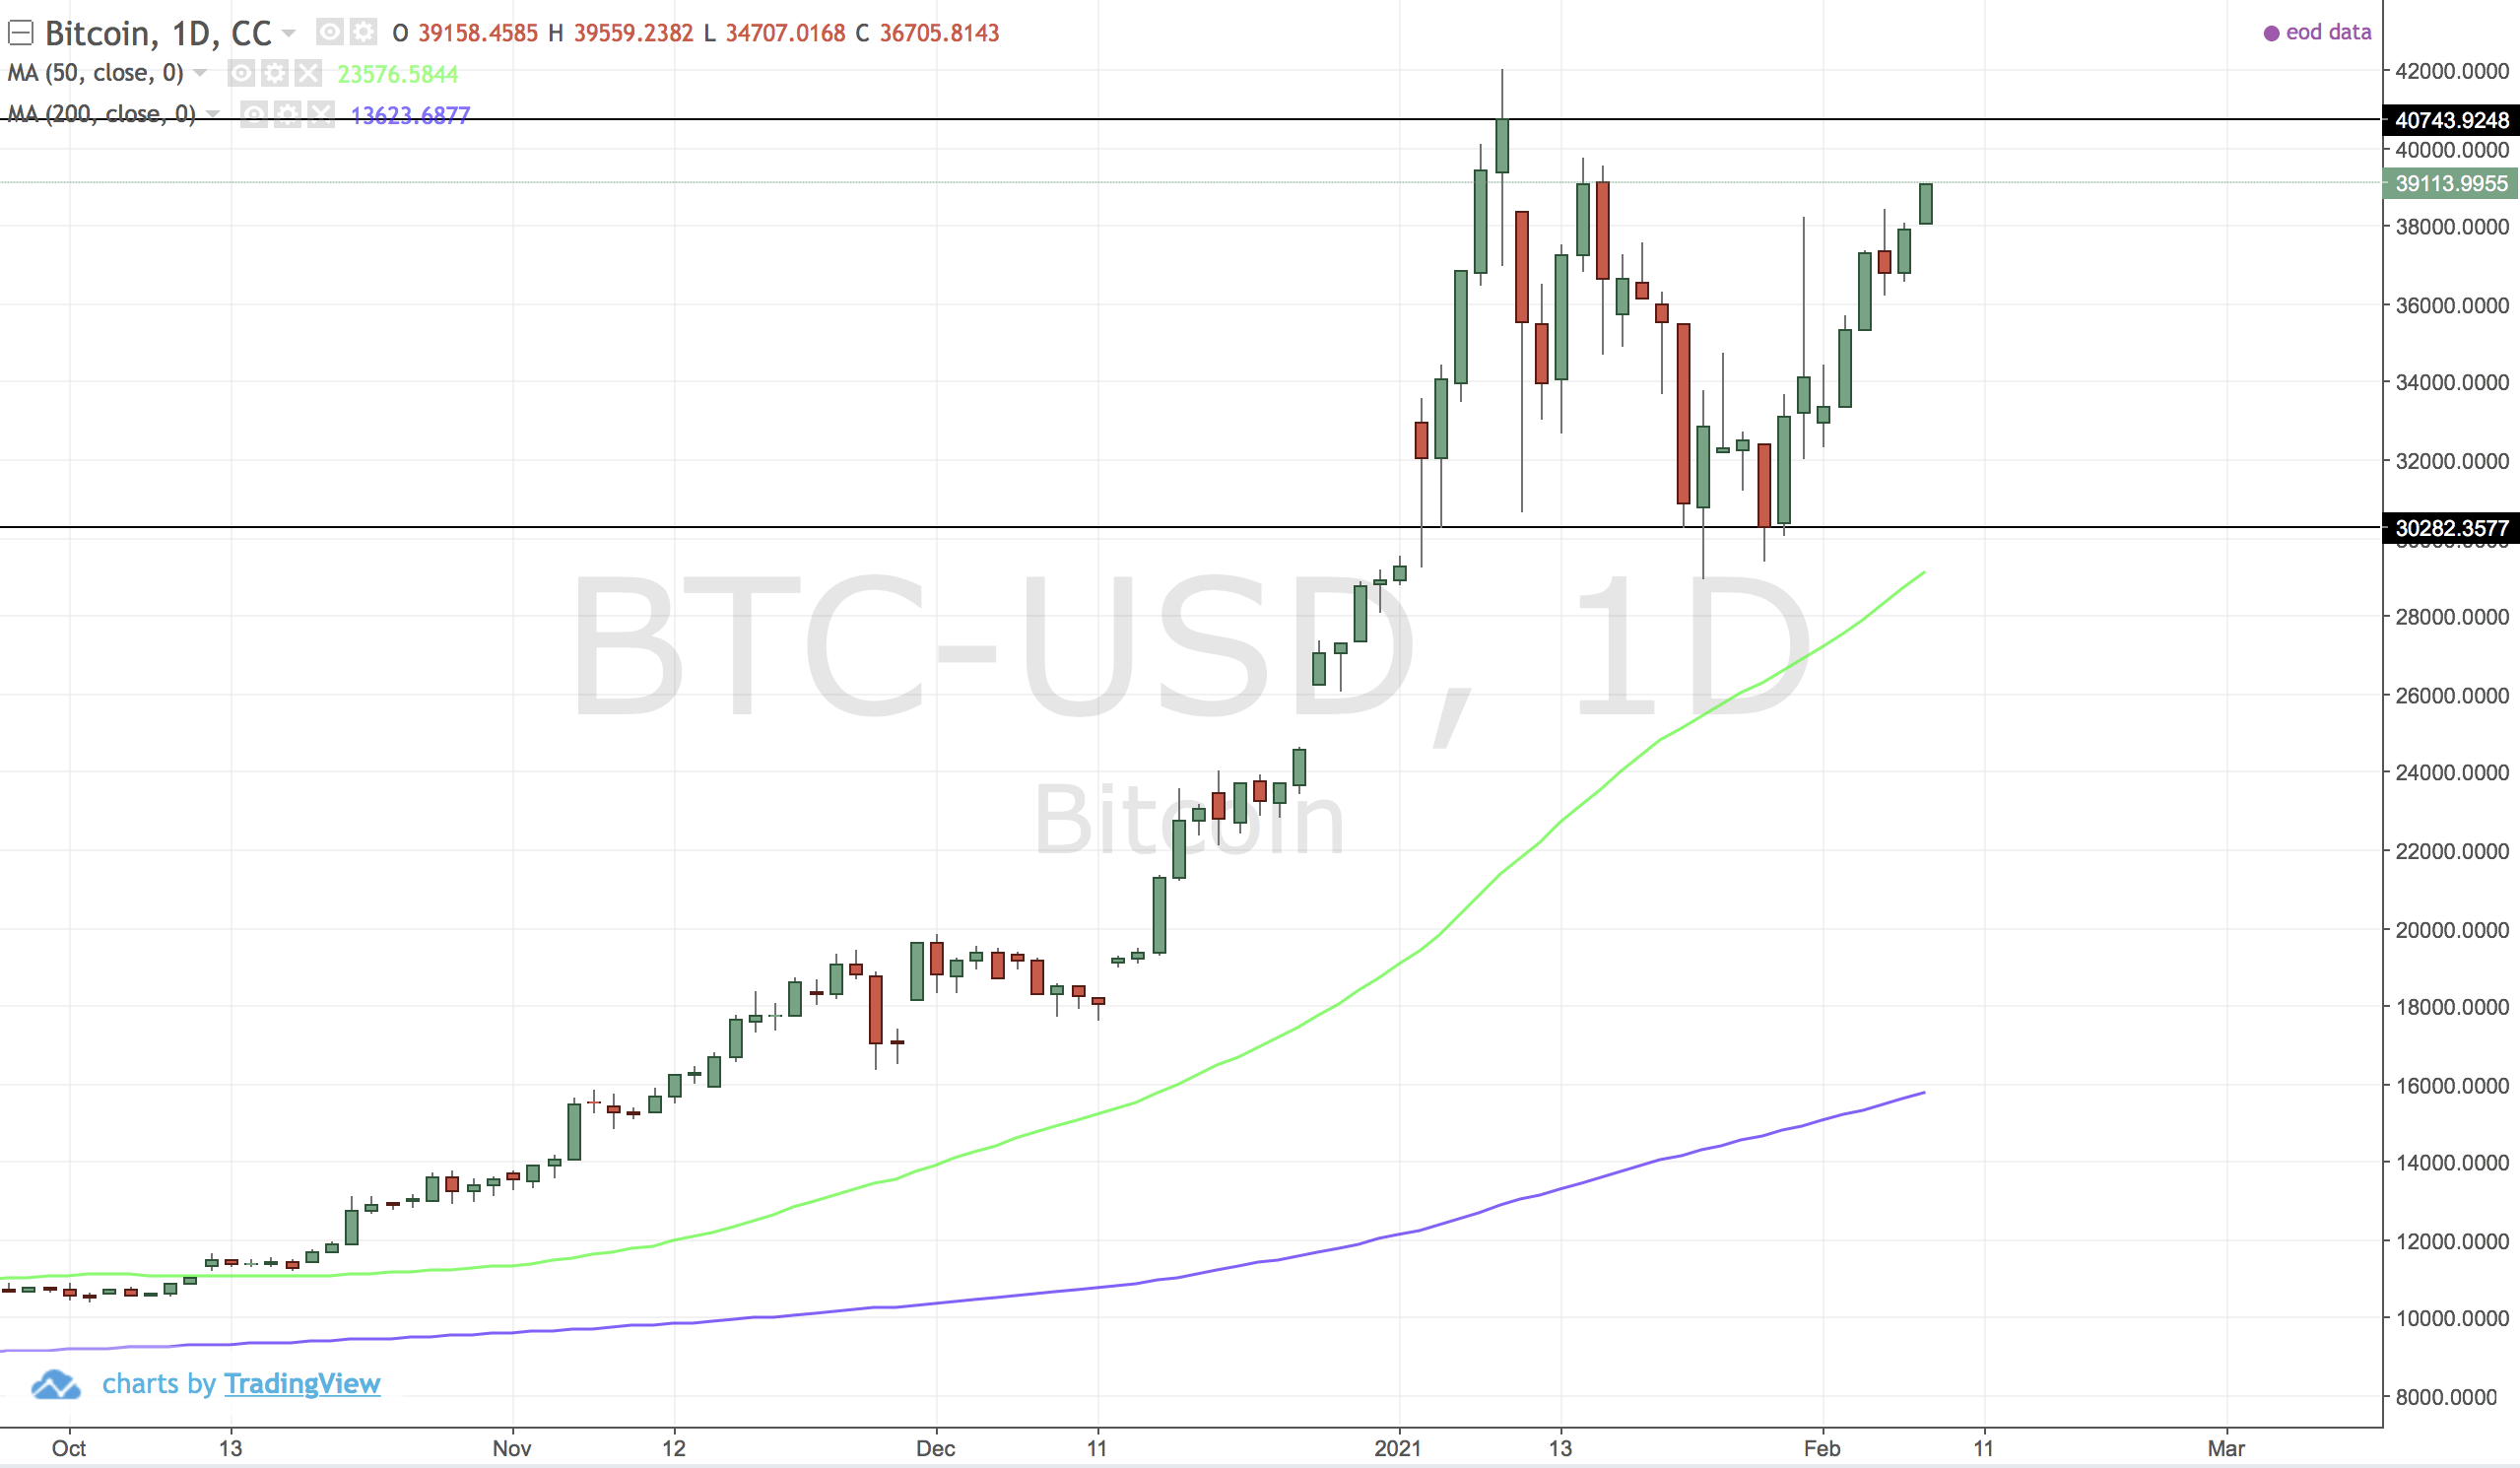
On the daily. Still struggling to break above 40700.
COMM:CL (Crude Oil)
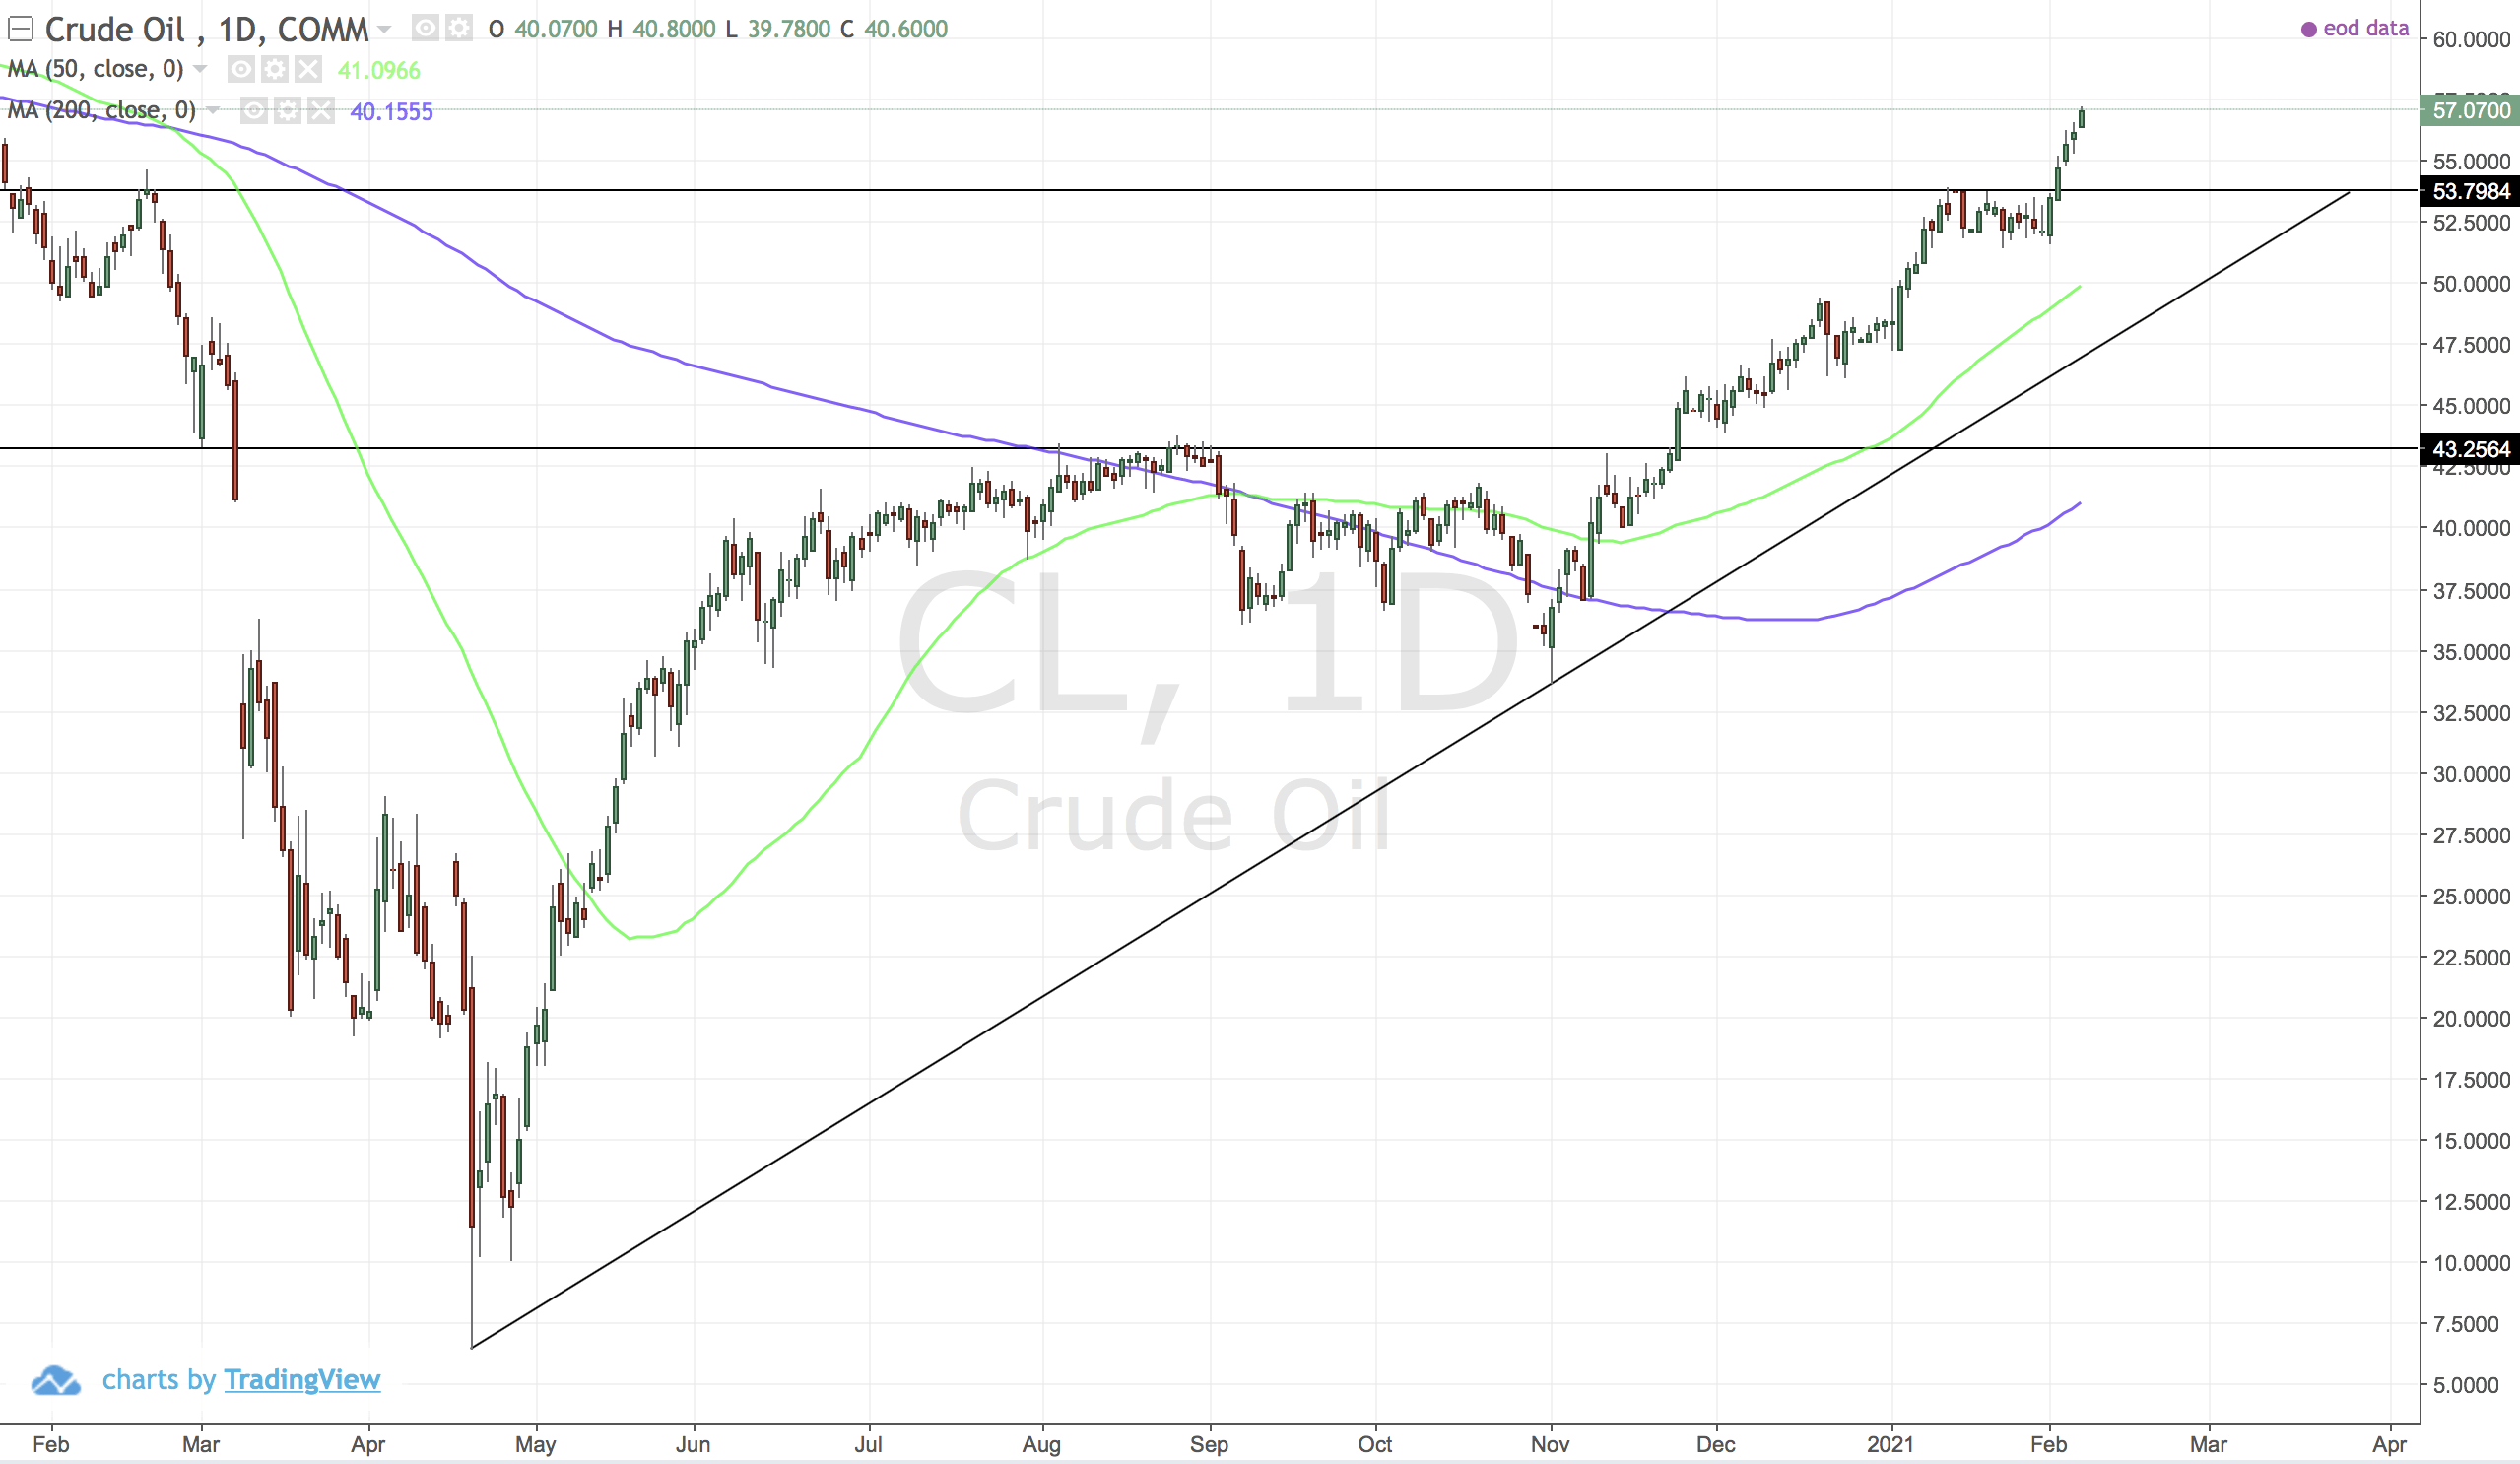
Daily chart, well on the way up.Broke through resistance and looking to continue.
COMM:GC (Gold)
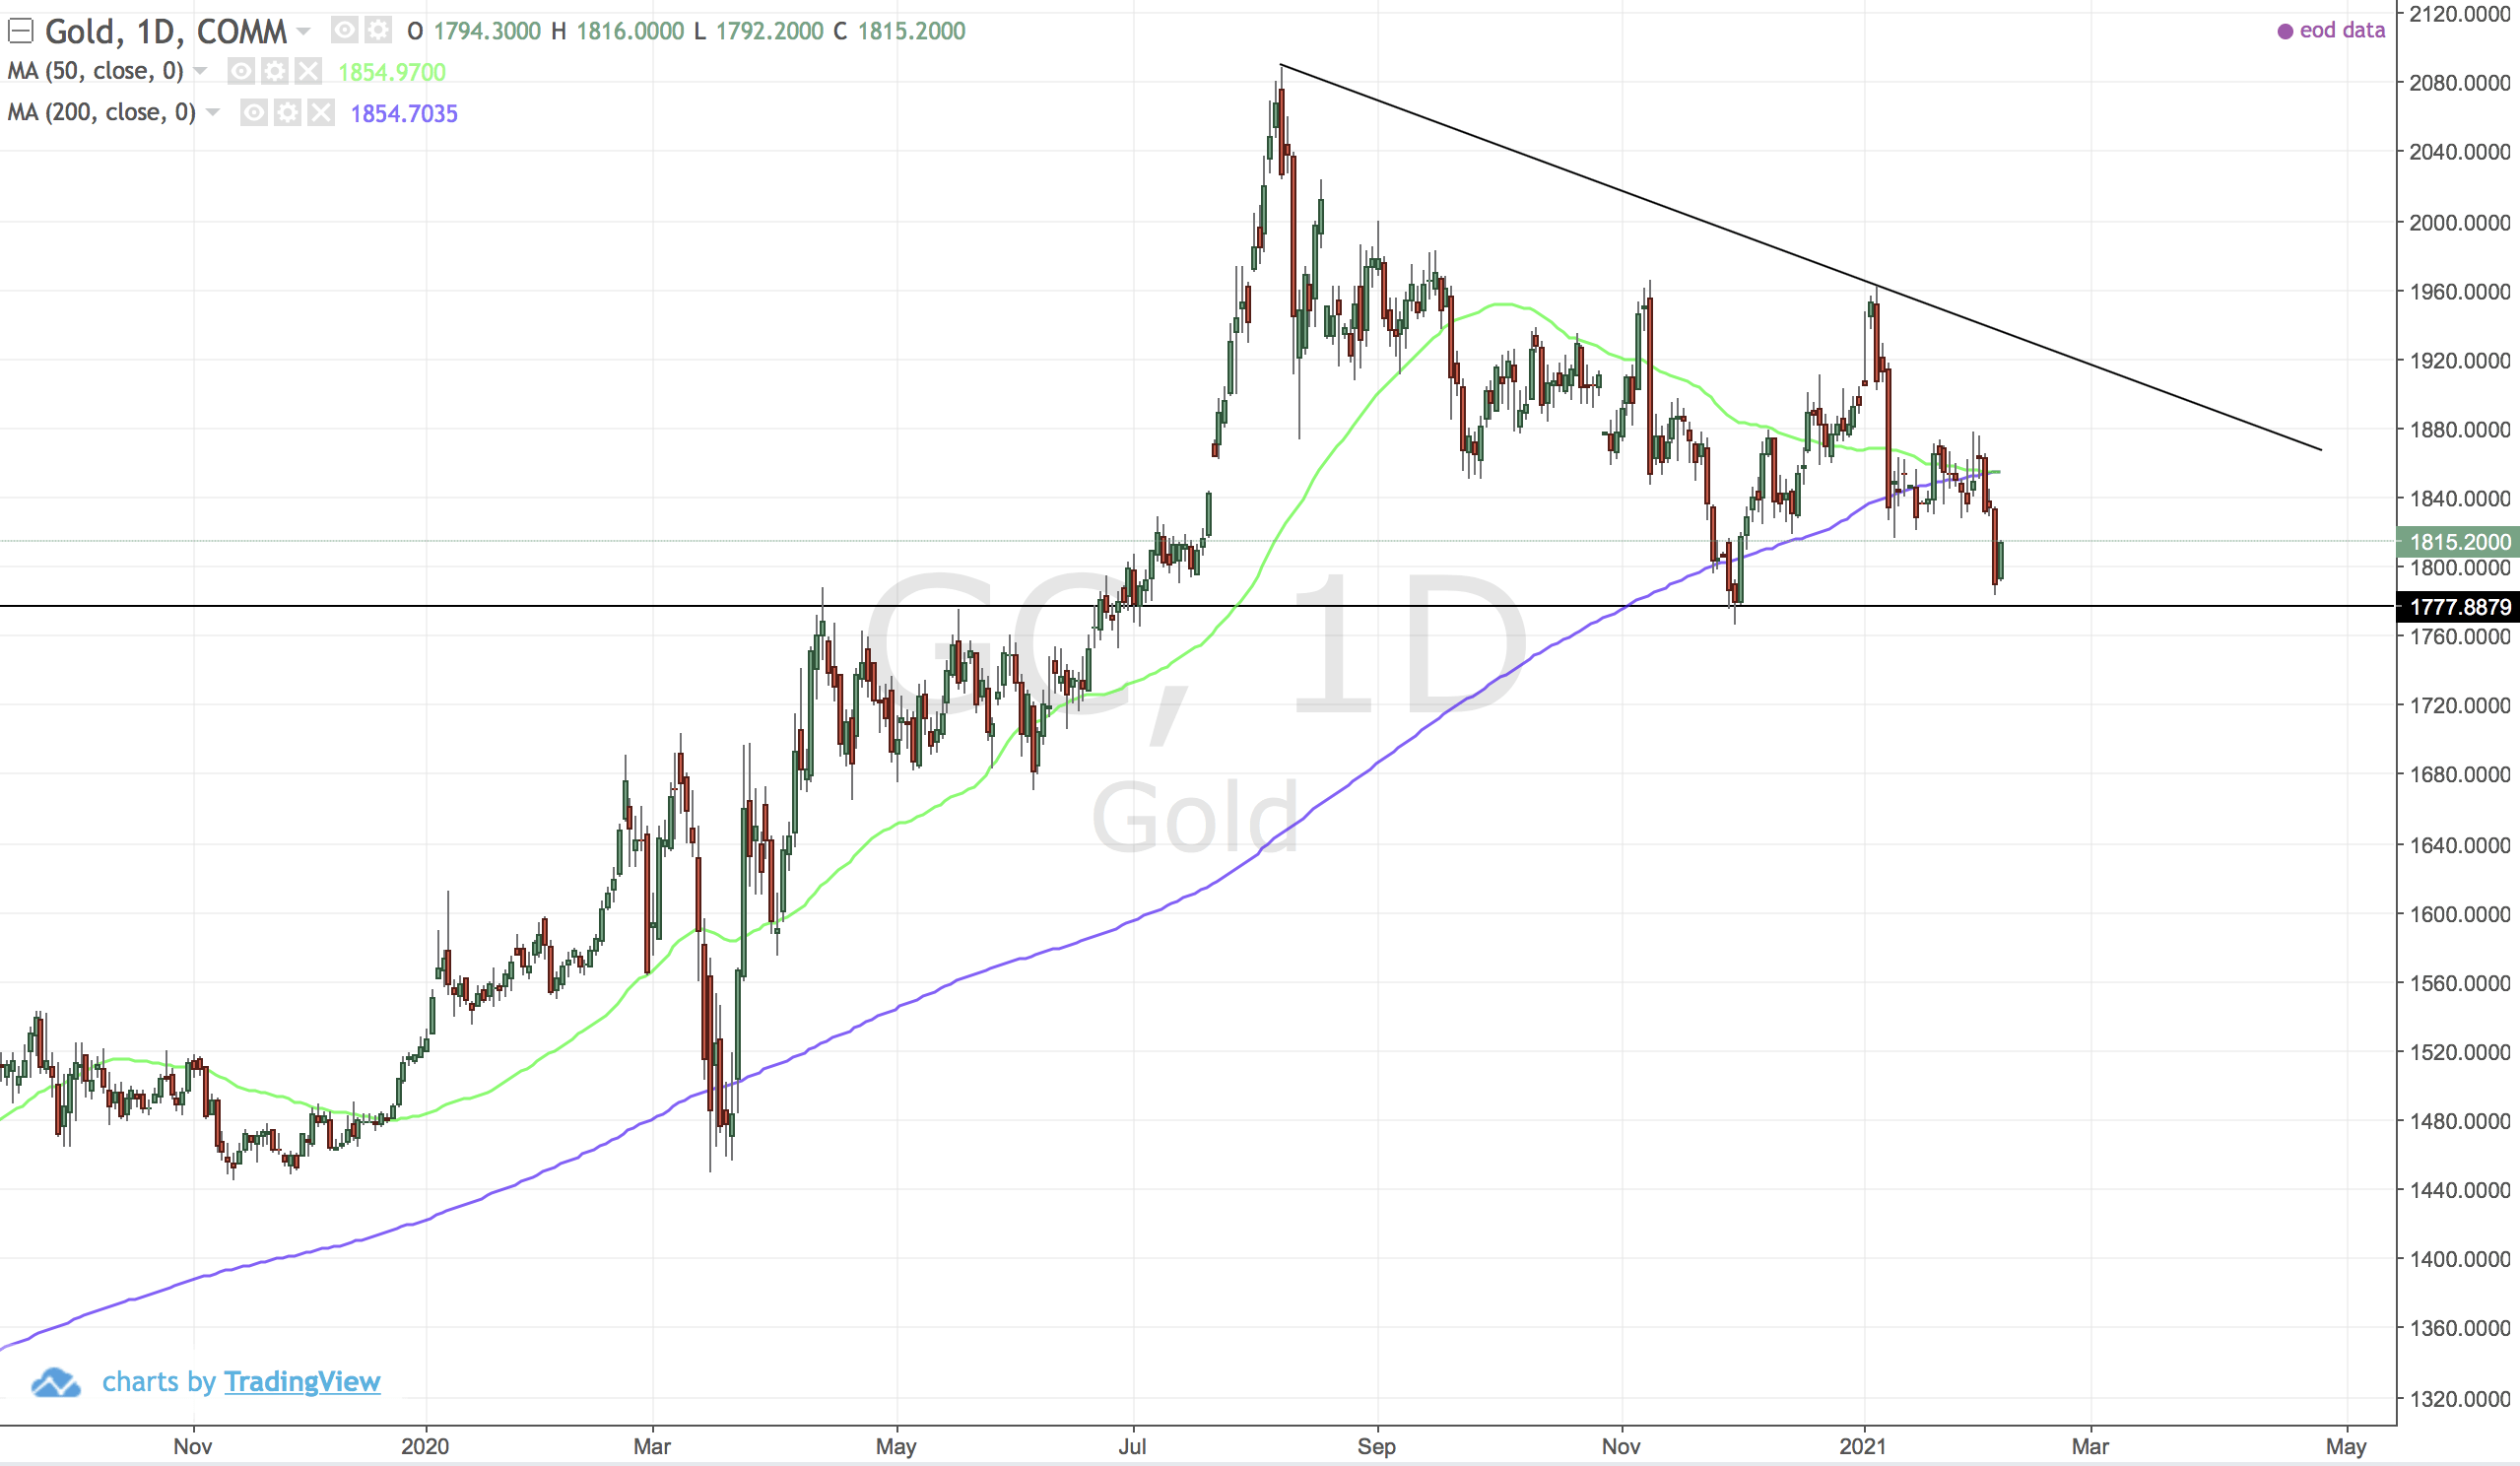
Only below 1777 should we worry. Still holding well.If it breaks up which I think it will - be ready!
COMM:PL (Platinum)
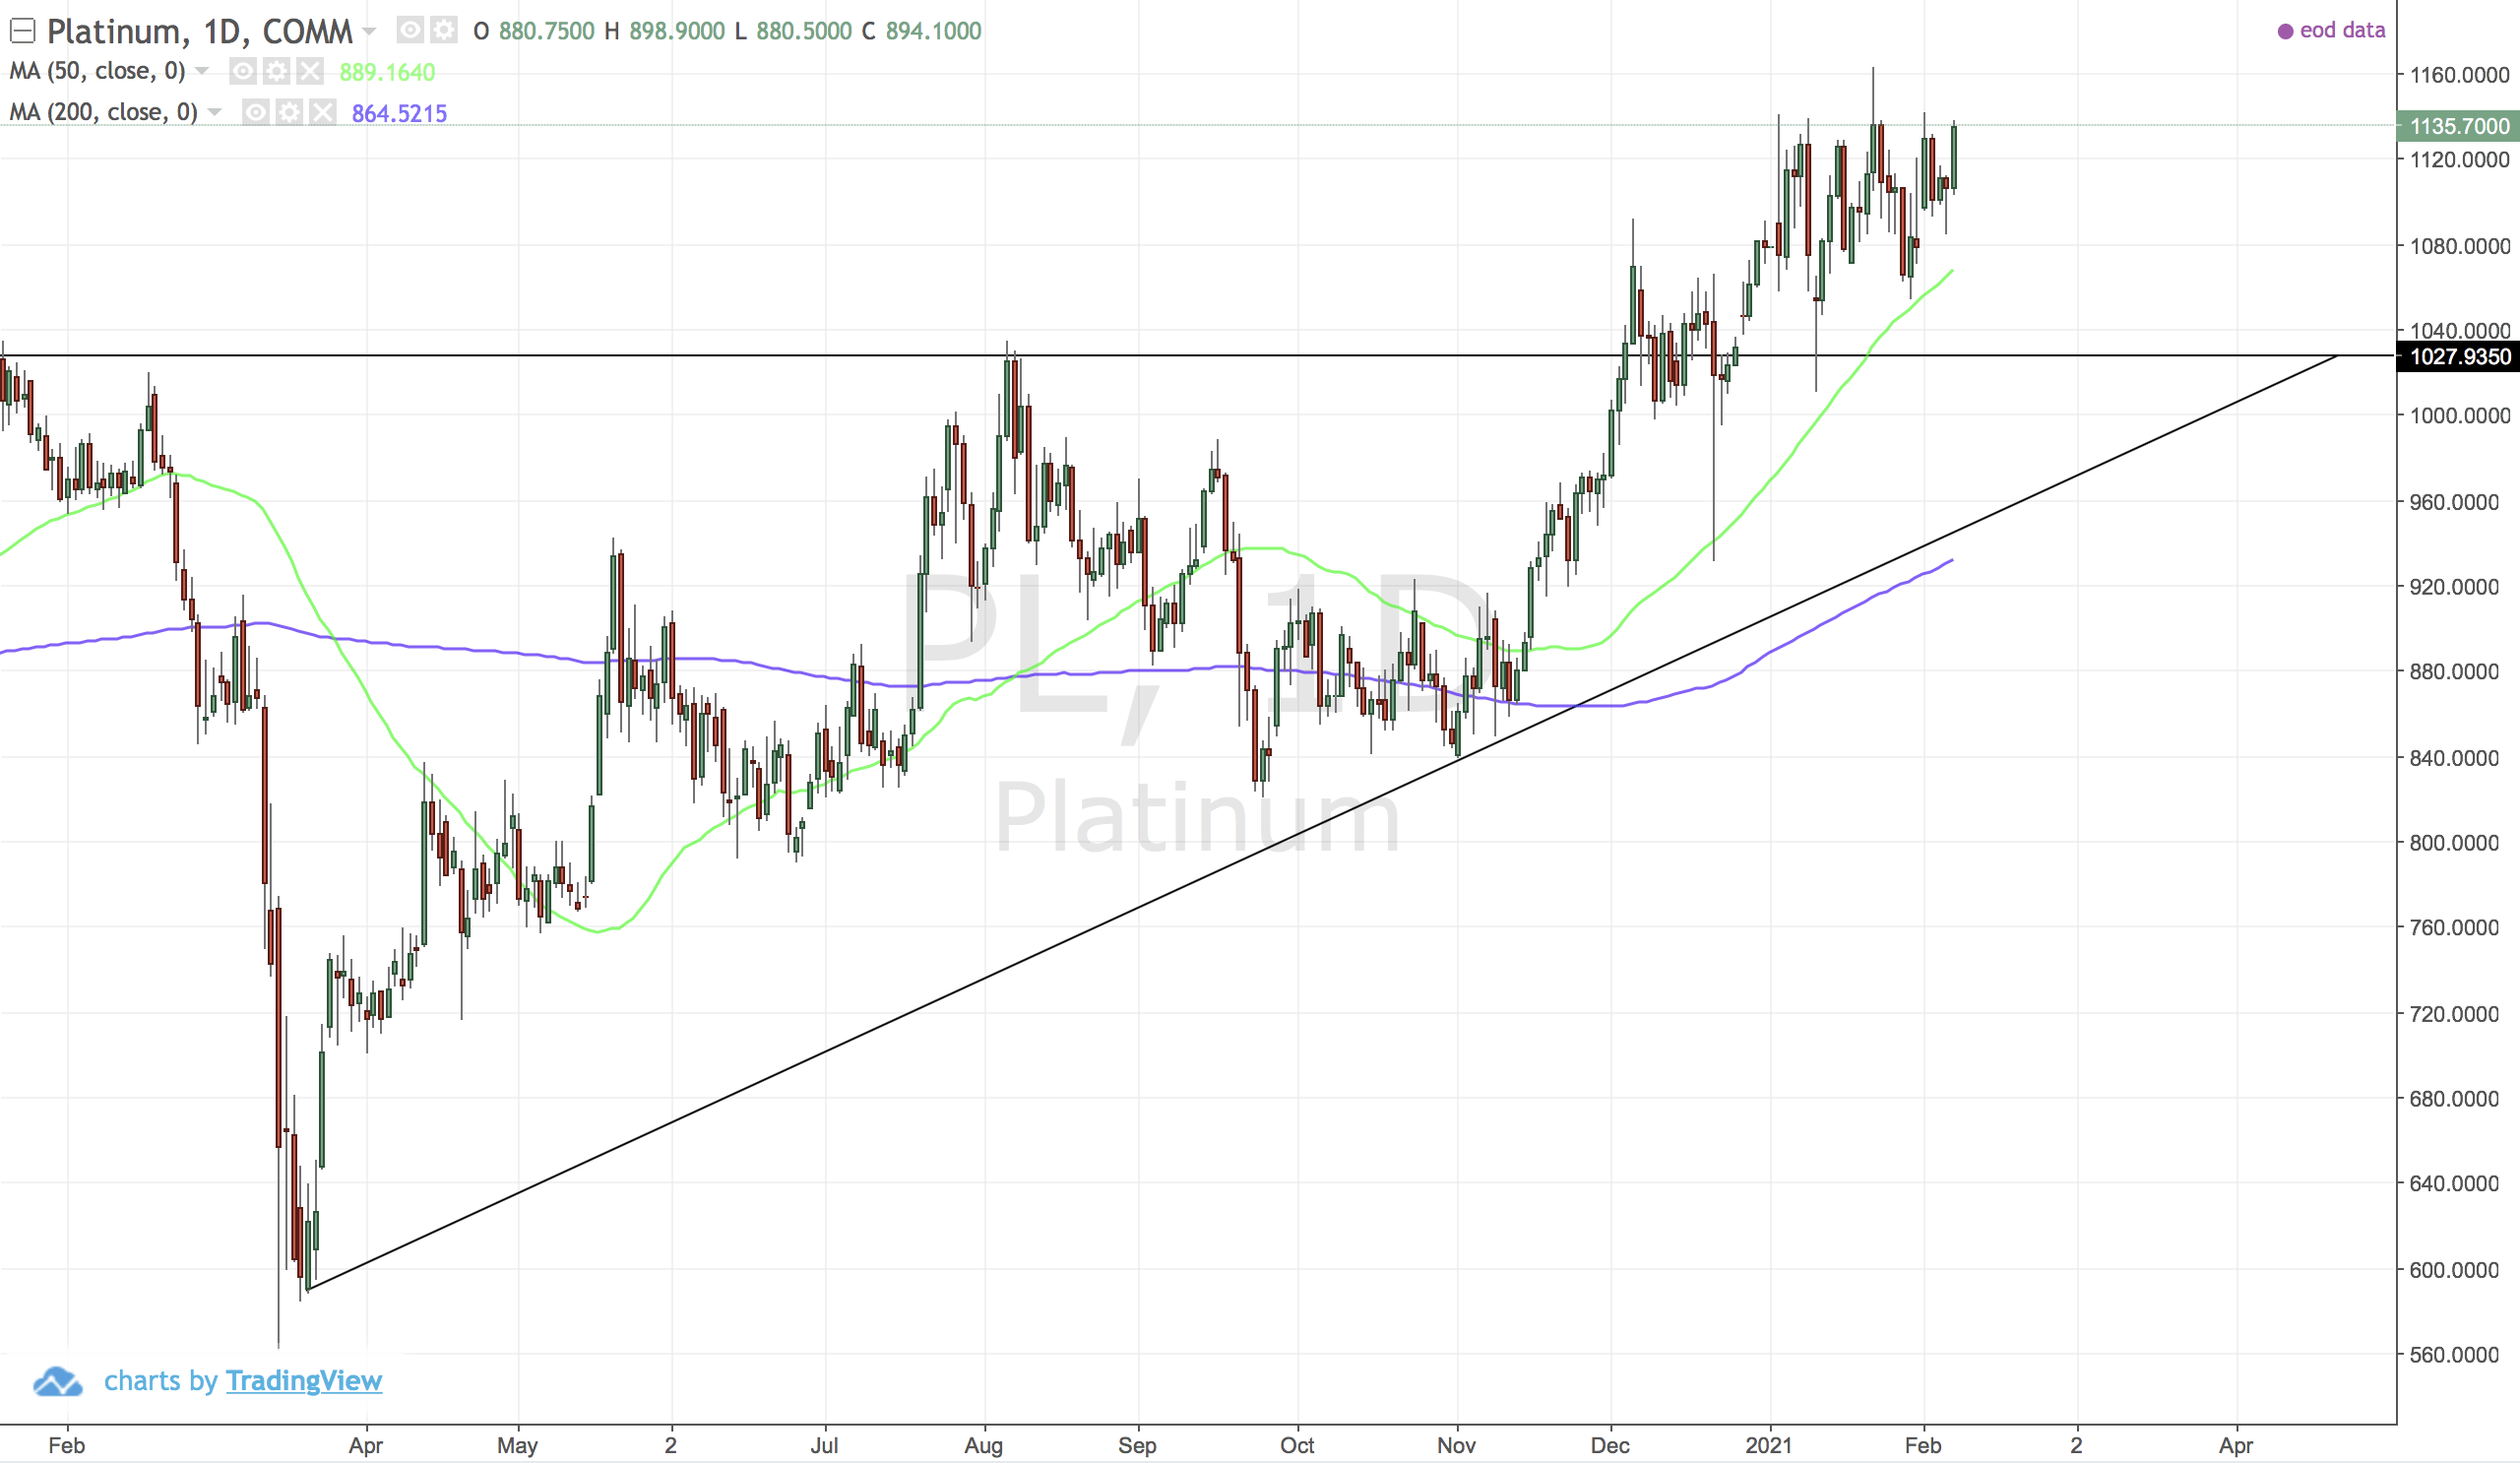
Trending up. Cup and handle break recently. Very good.I will be looking to add.
COMM:PA (Palladium)
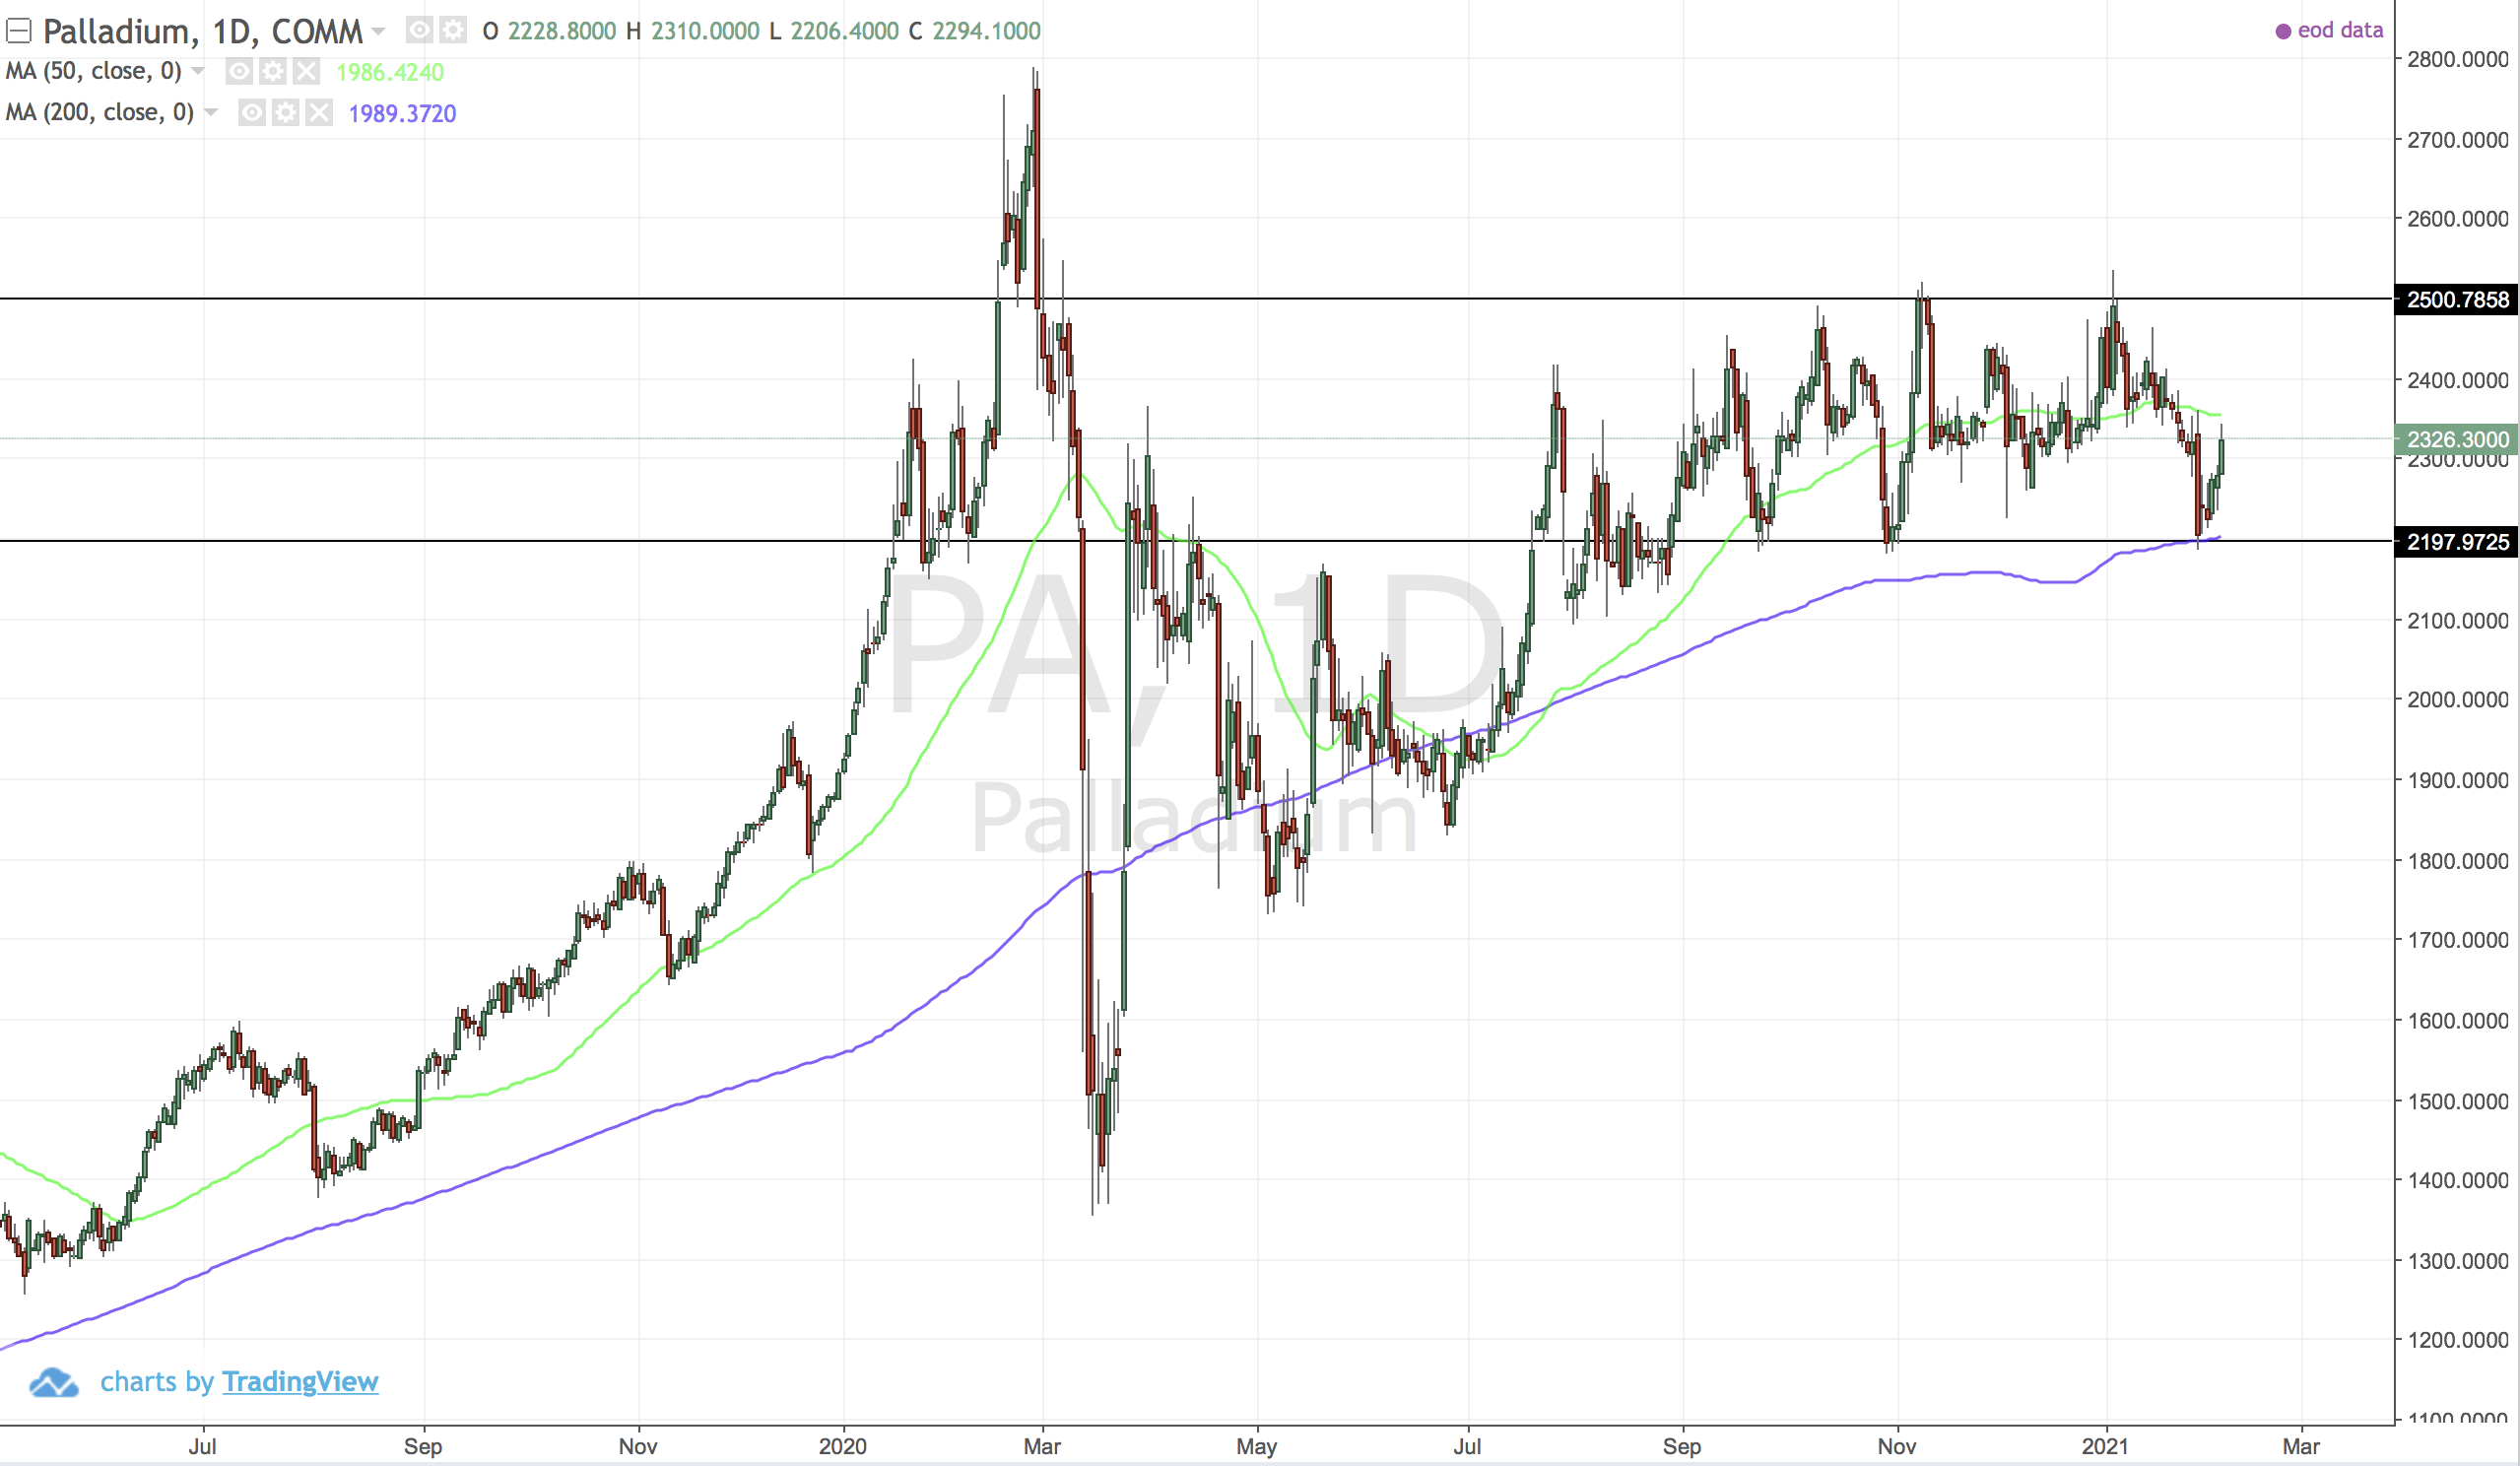
Losing steam. In danger of rolling over indicated by moving averages now pointing down.
INDX:DJT (Dow Jones Transport Average)
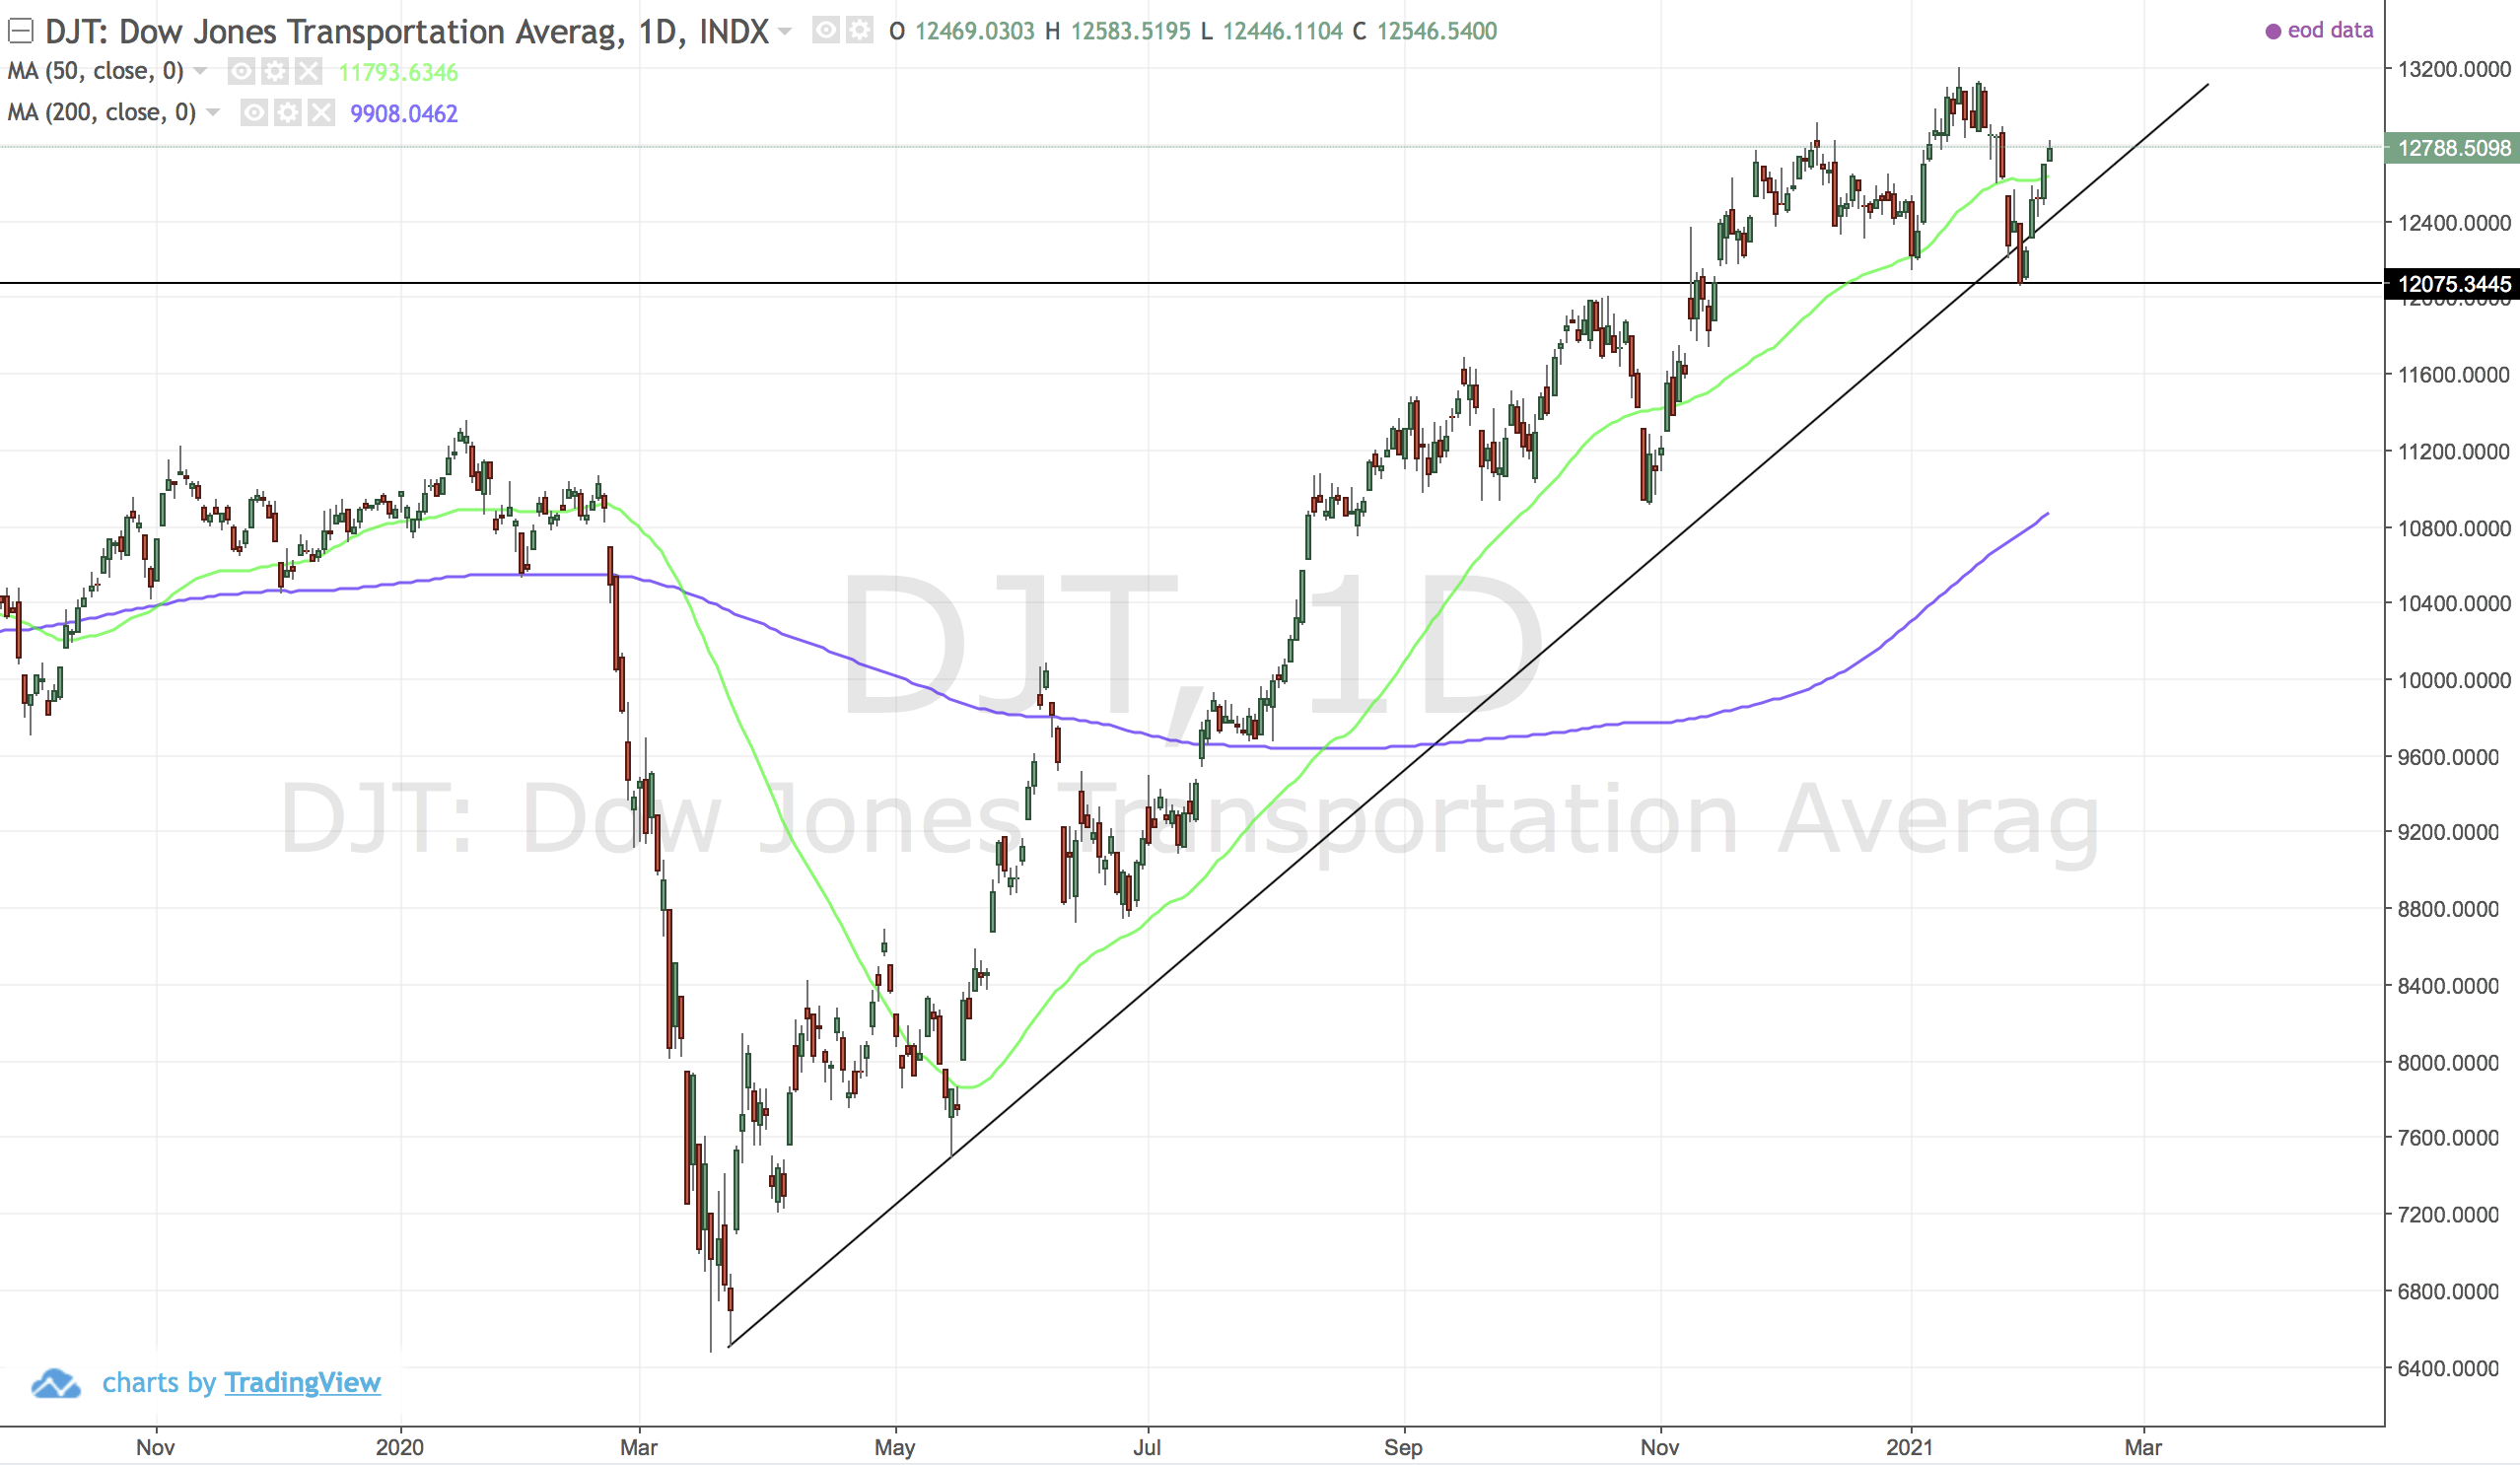
Whipsaw break below the trendline. Below 12000 is bad news. It is just giving us a warning for now.
INDX:GSPC (SP500)
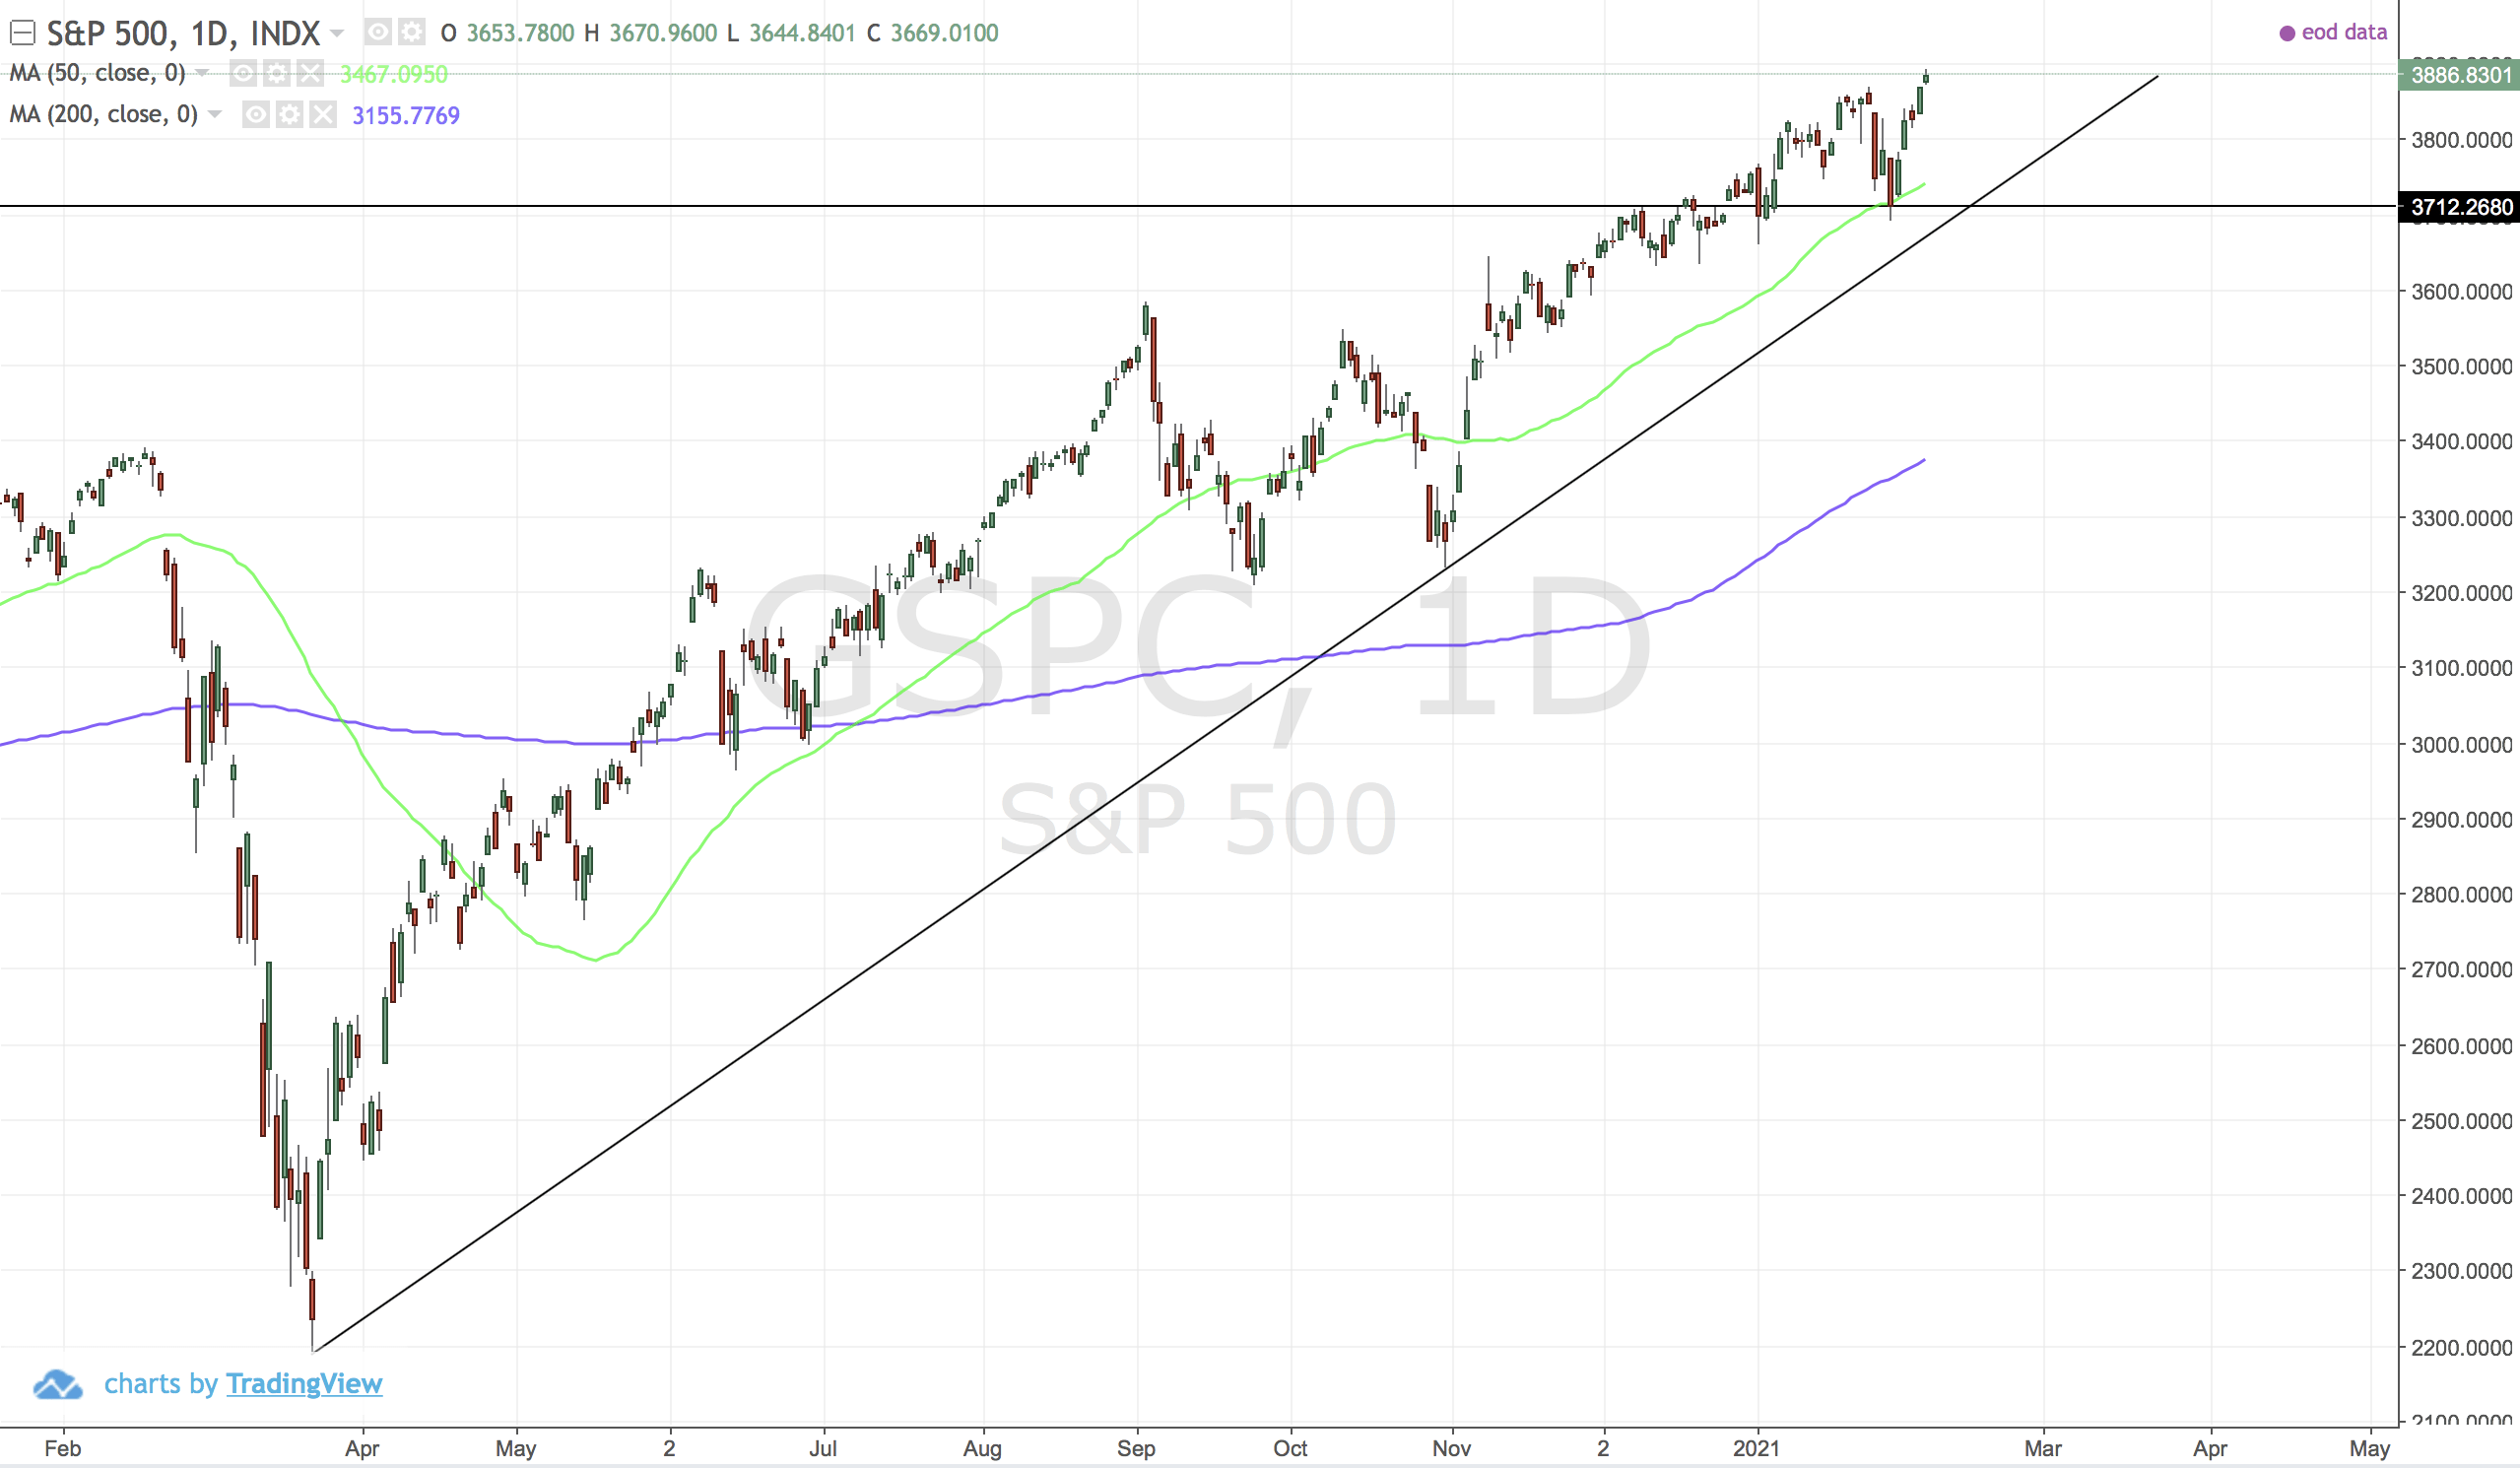
Trending up.
INDX:JTOPI (JSE Top40 Index)
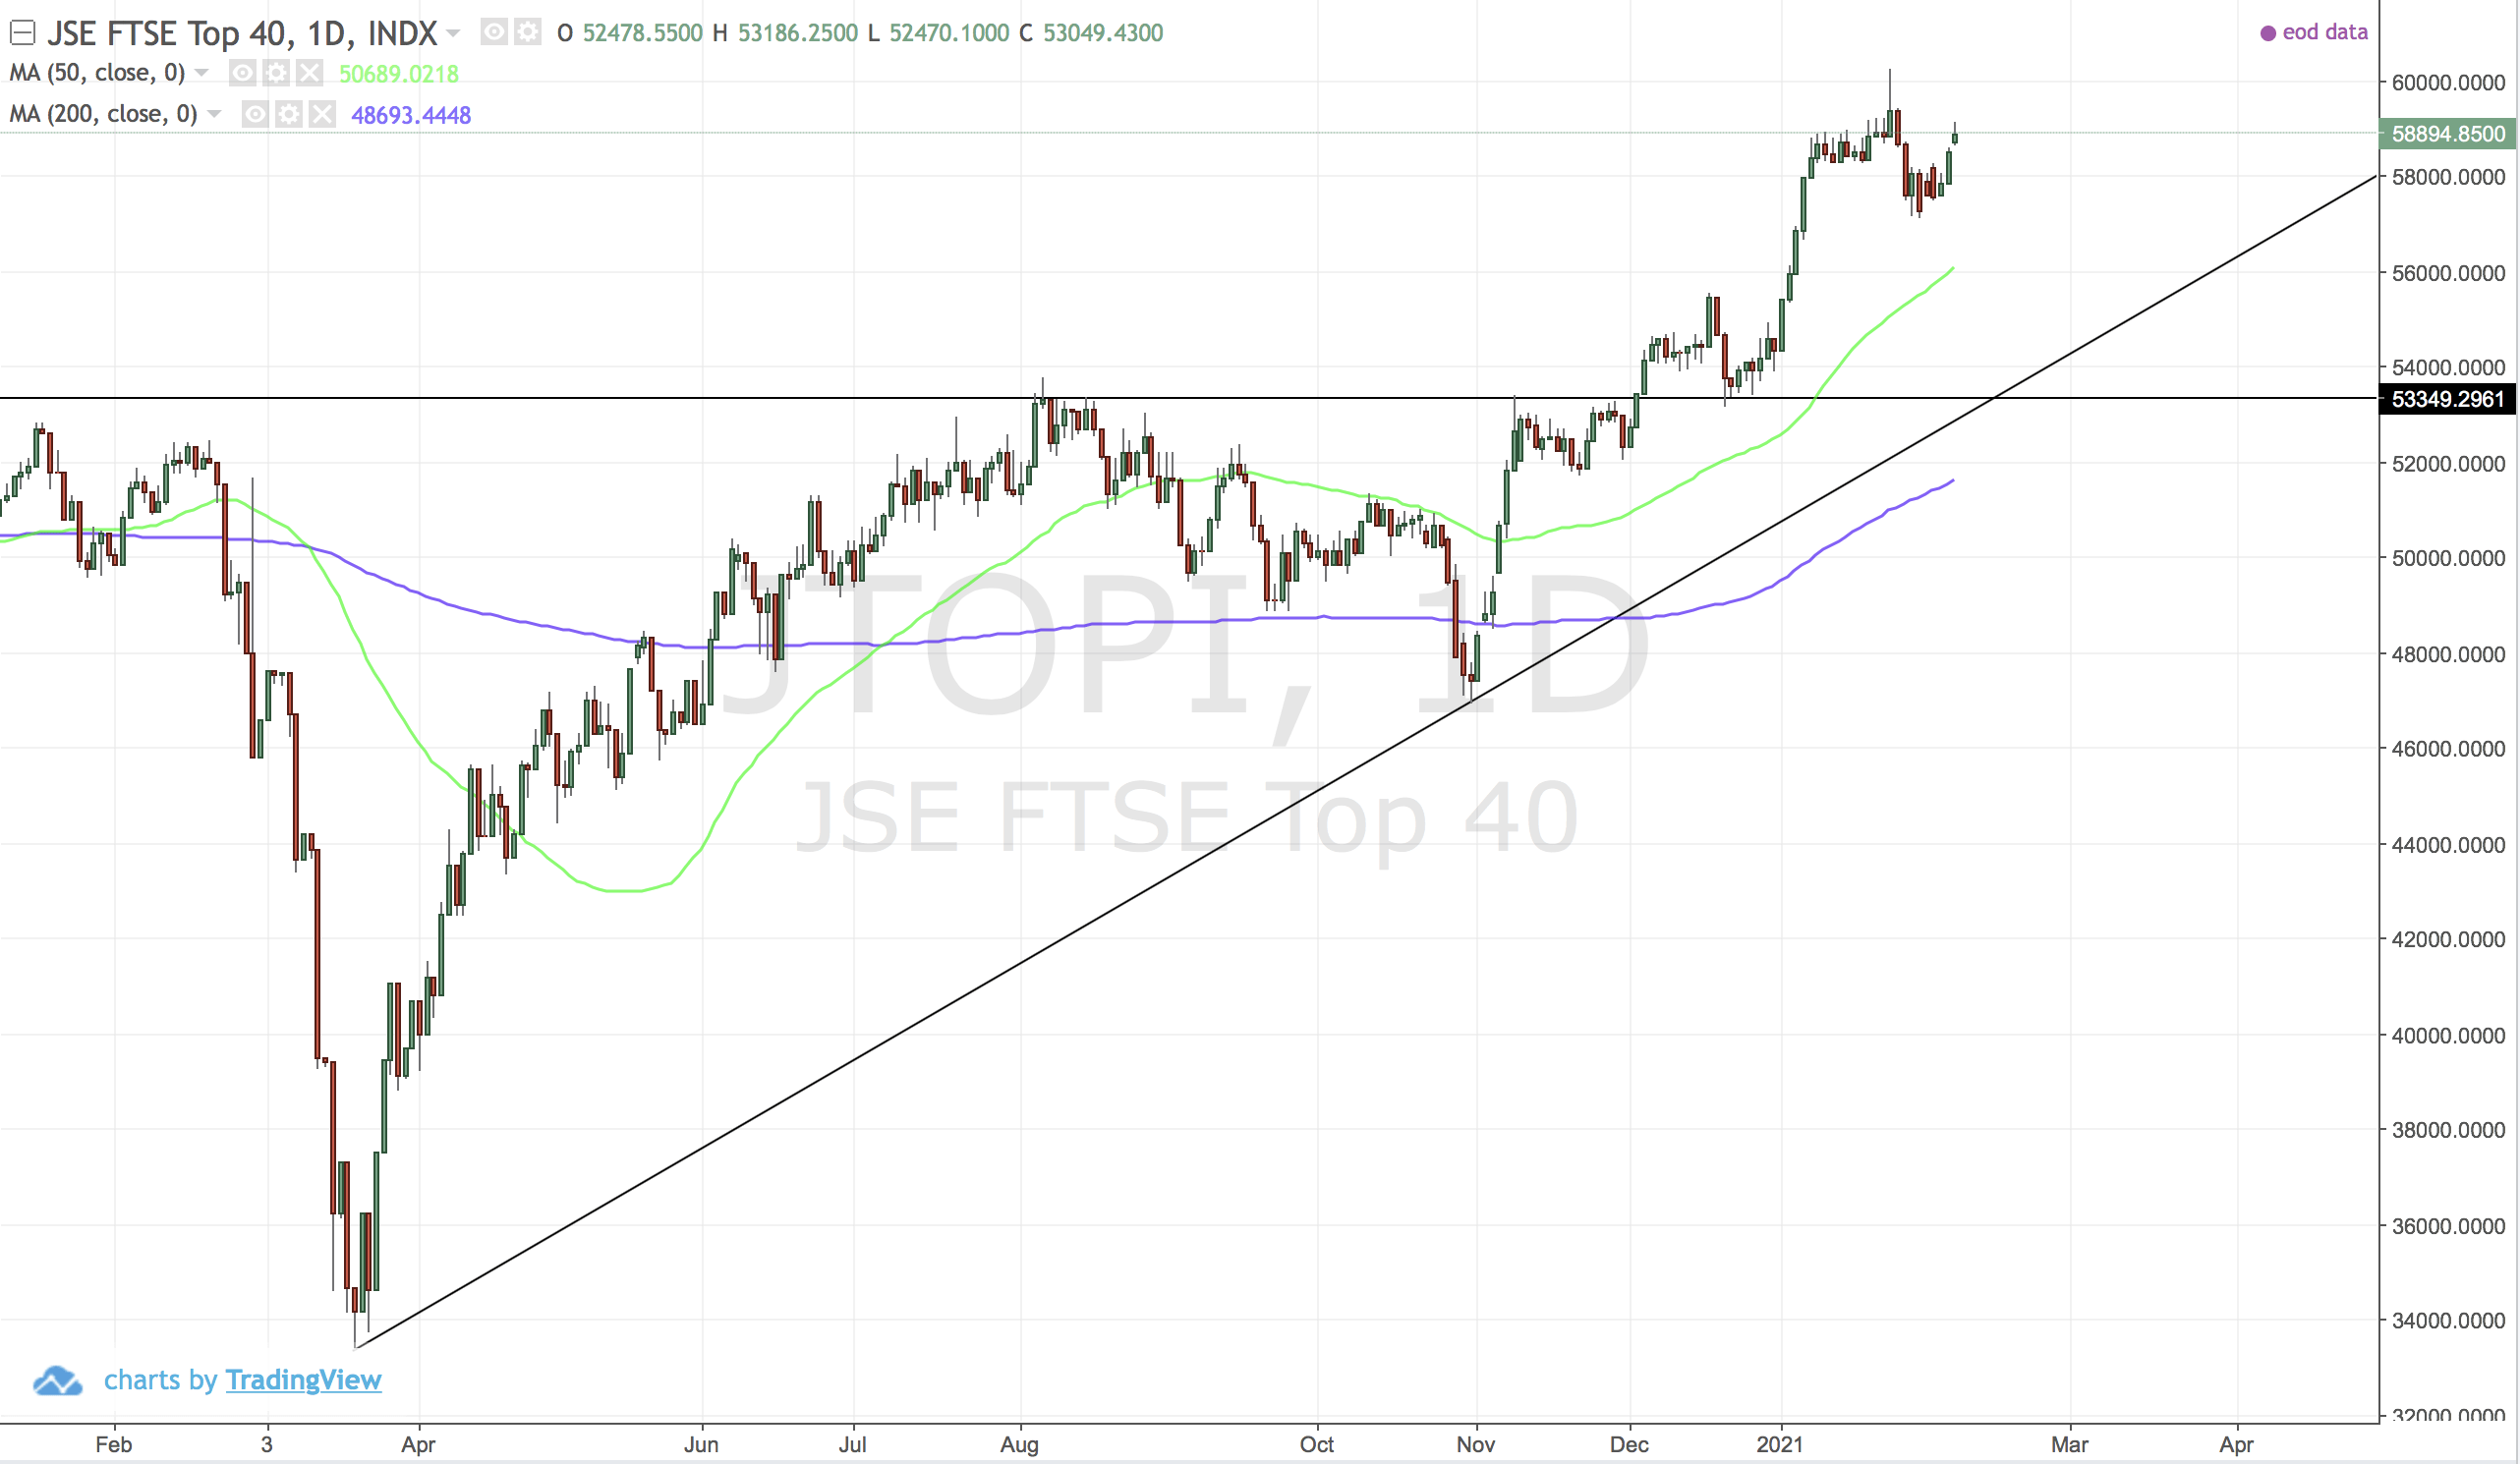
Well and truly in the upward trajectory.
JSE Stocks
JSE:SBK (Standard Bank)
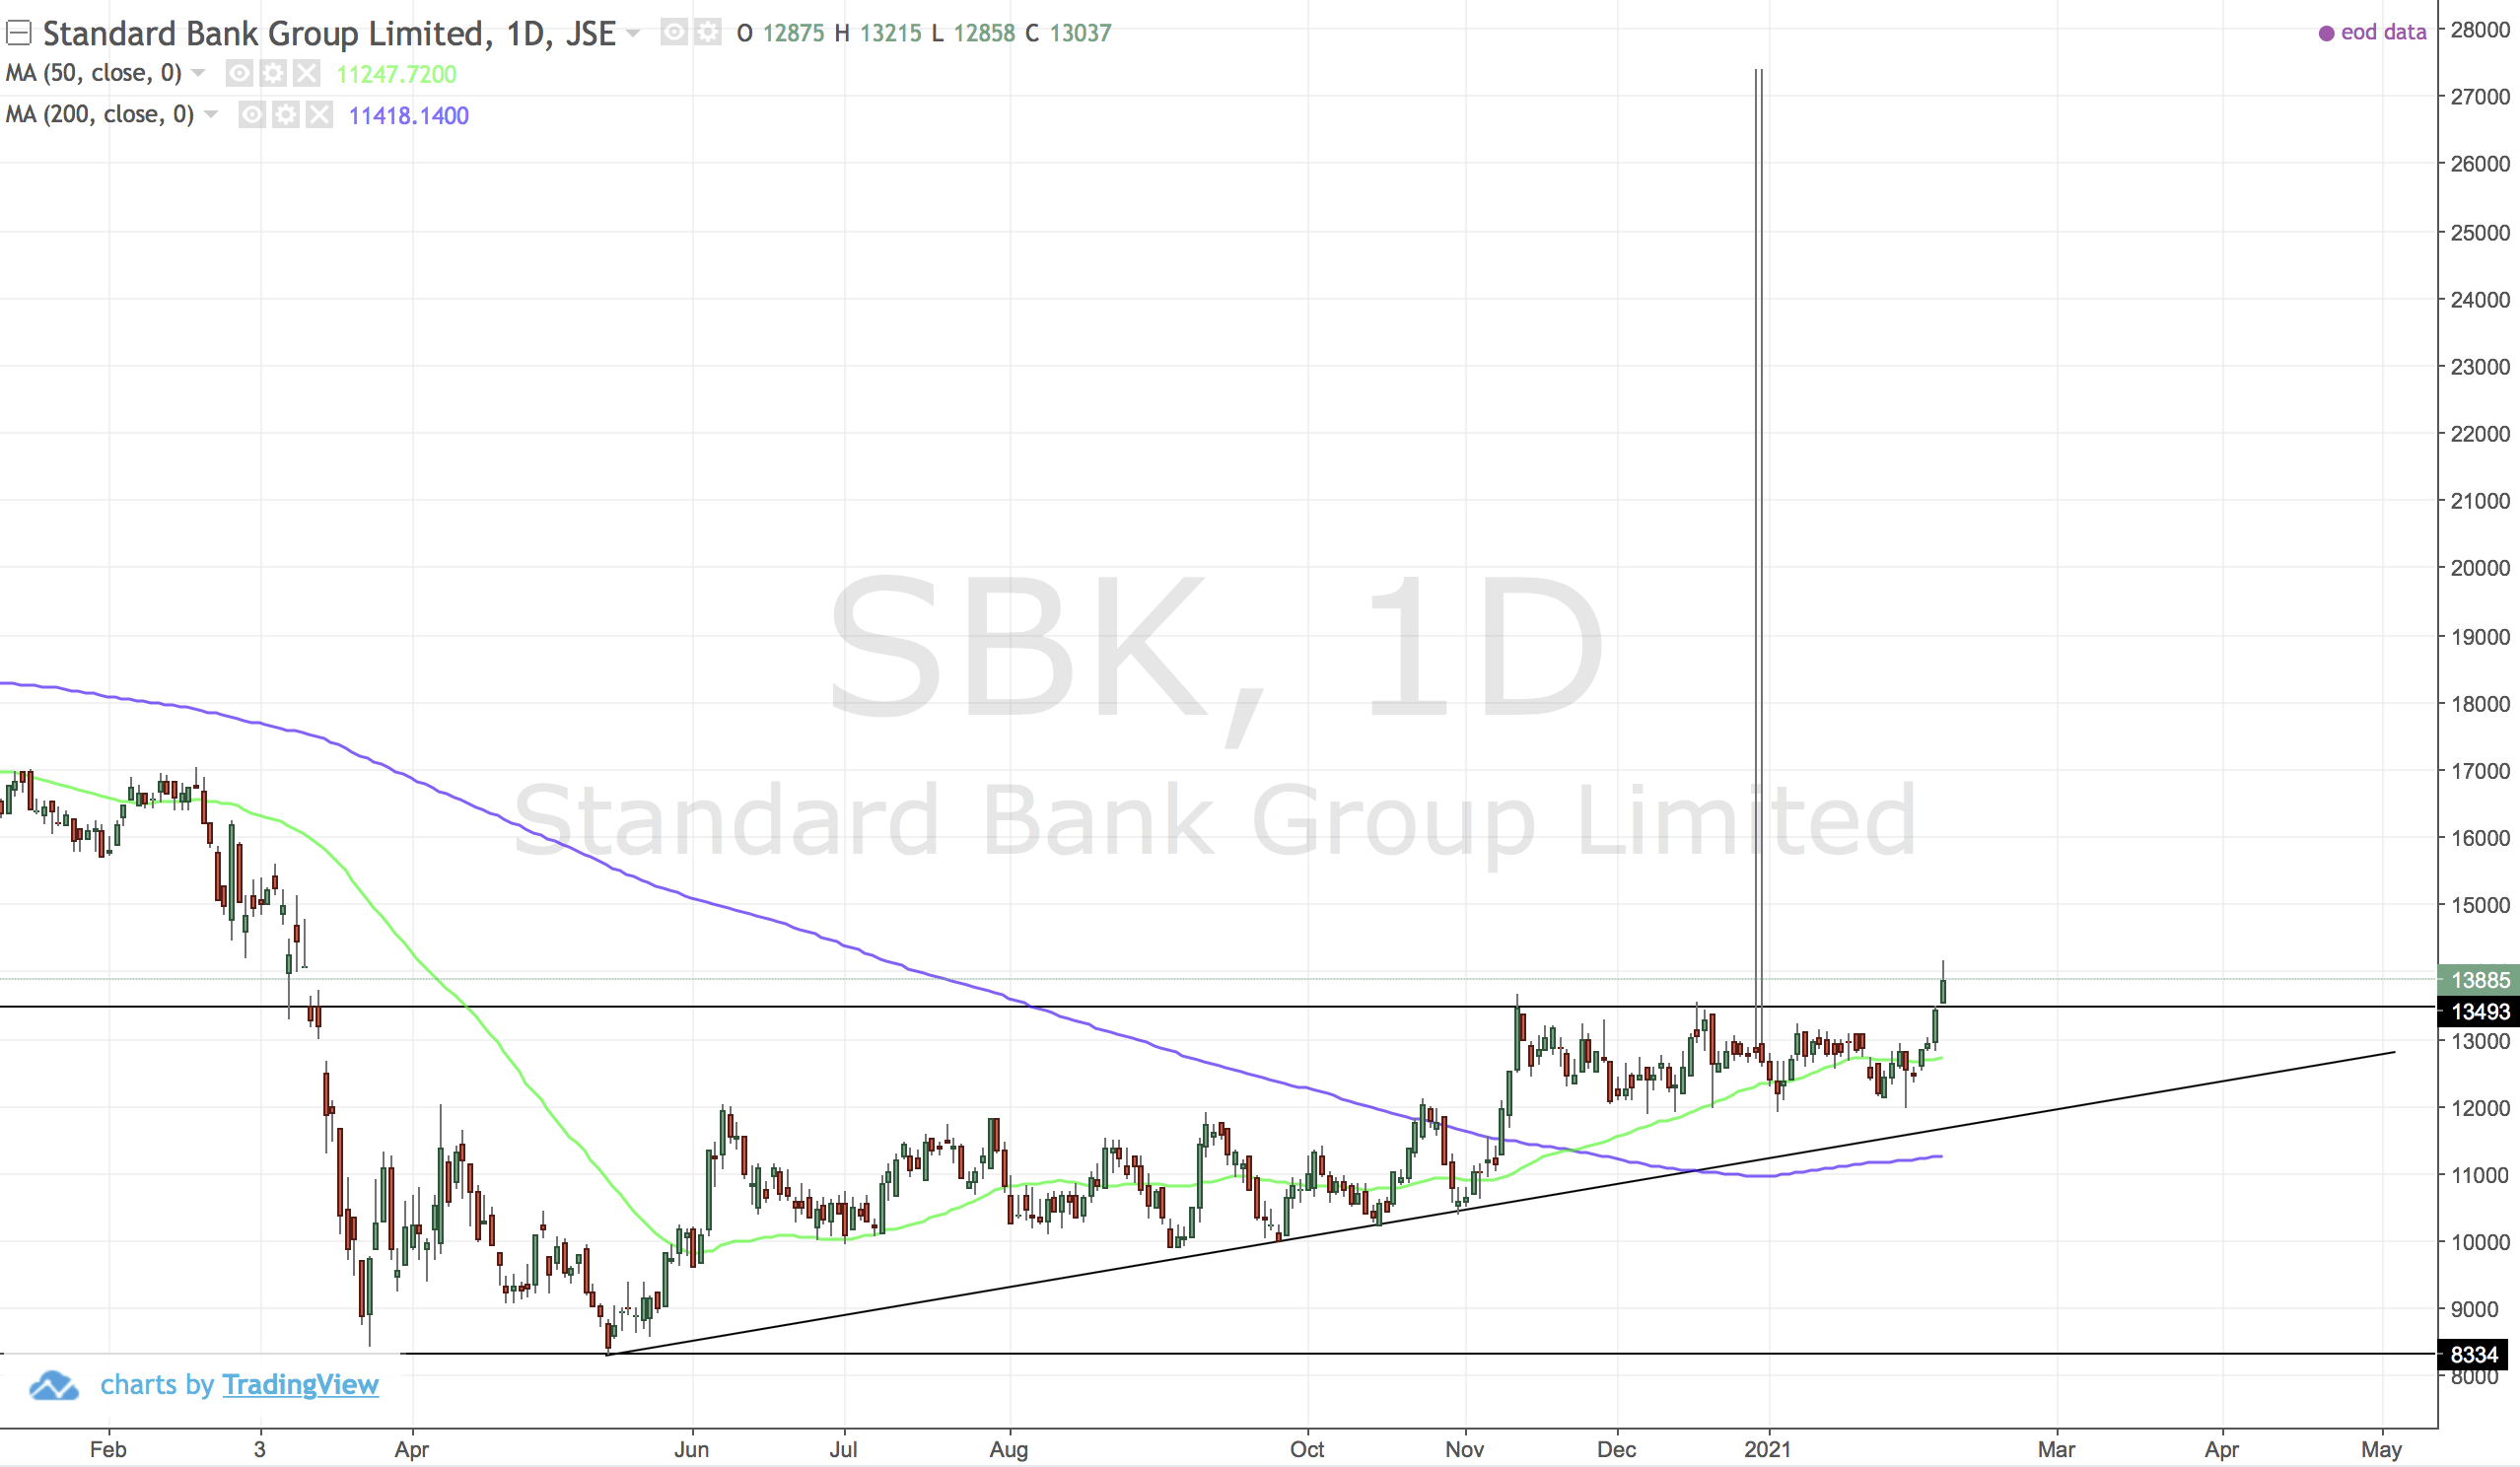
Sorry 2 incorrect highs - from data provider. However the cup and handle has broken and as long as the rand is strong against the dollar this stock strength looks to continue.
JSE:CCO (Capital and Counties)
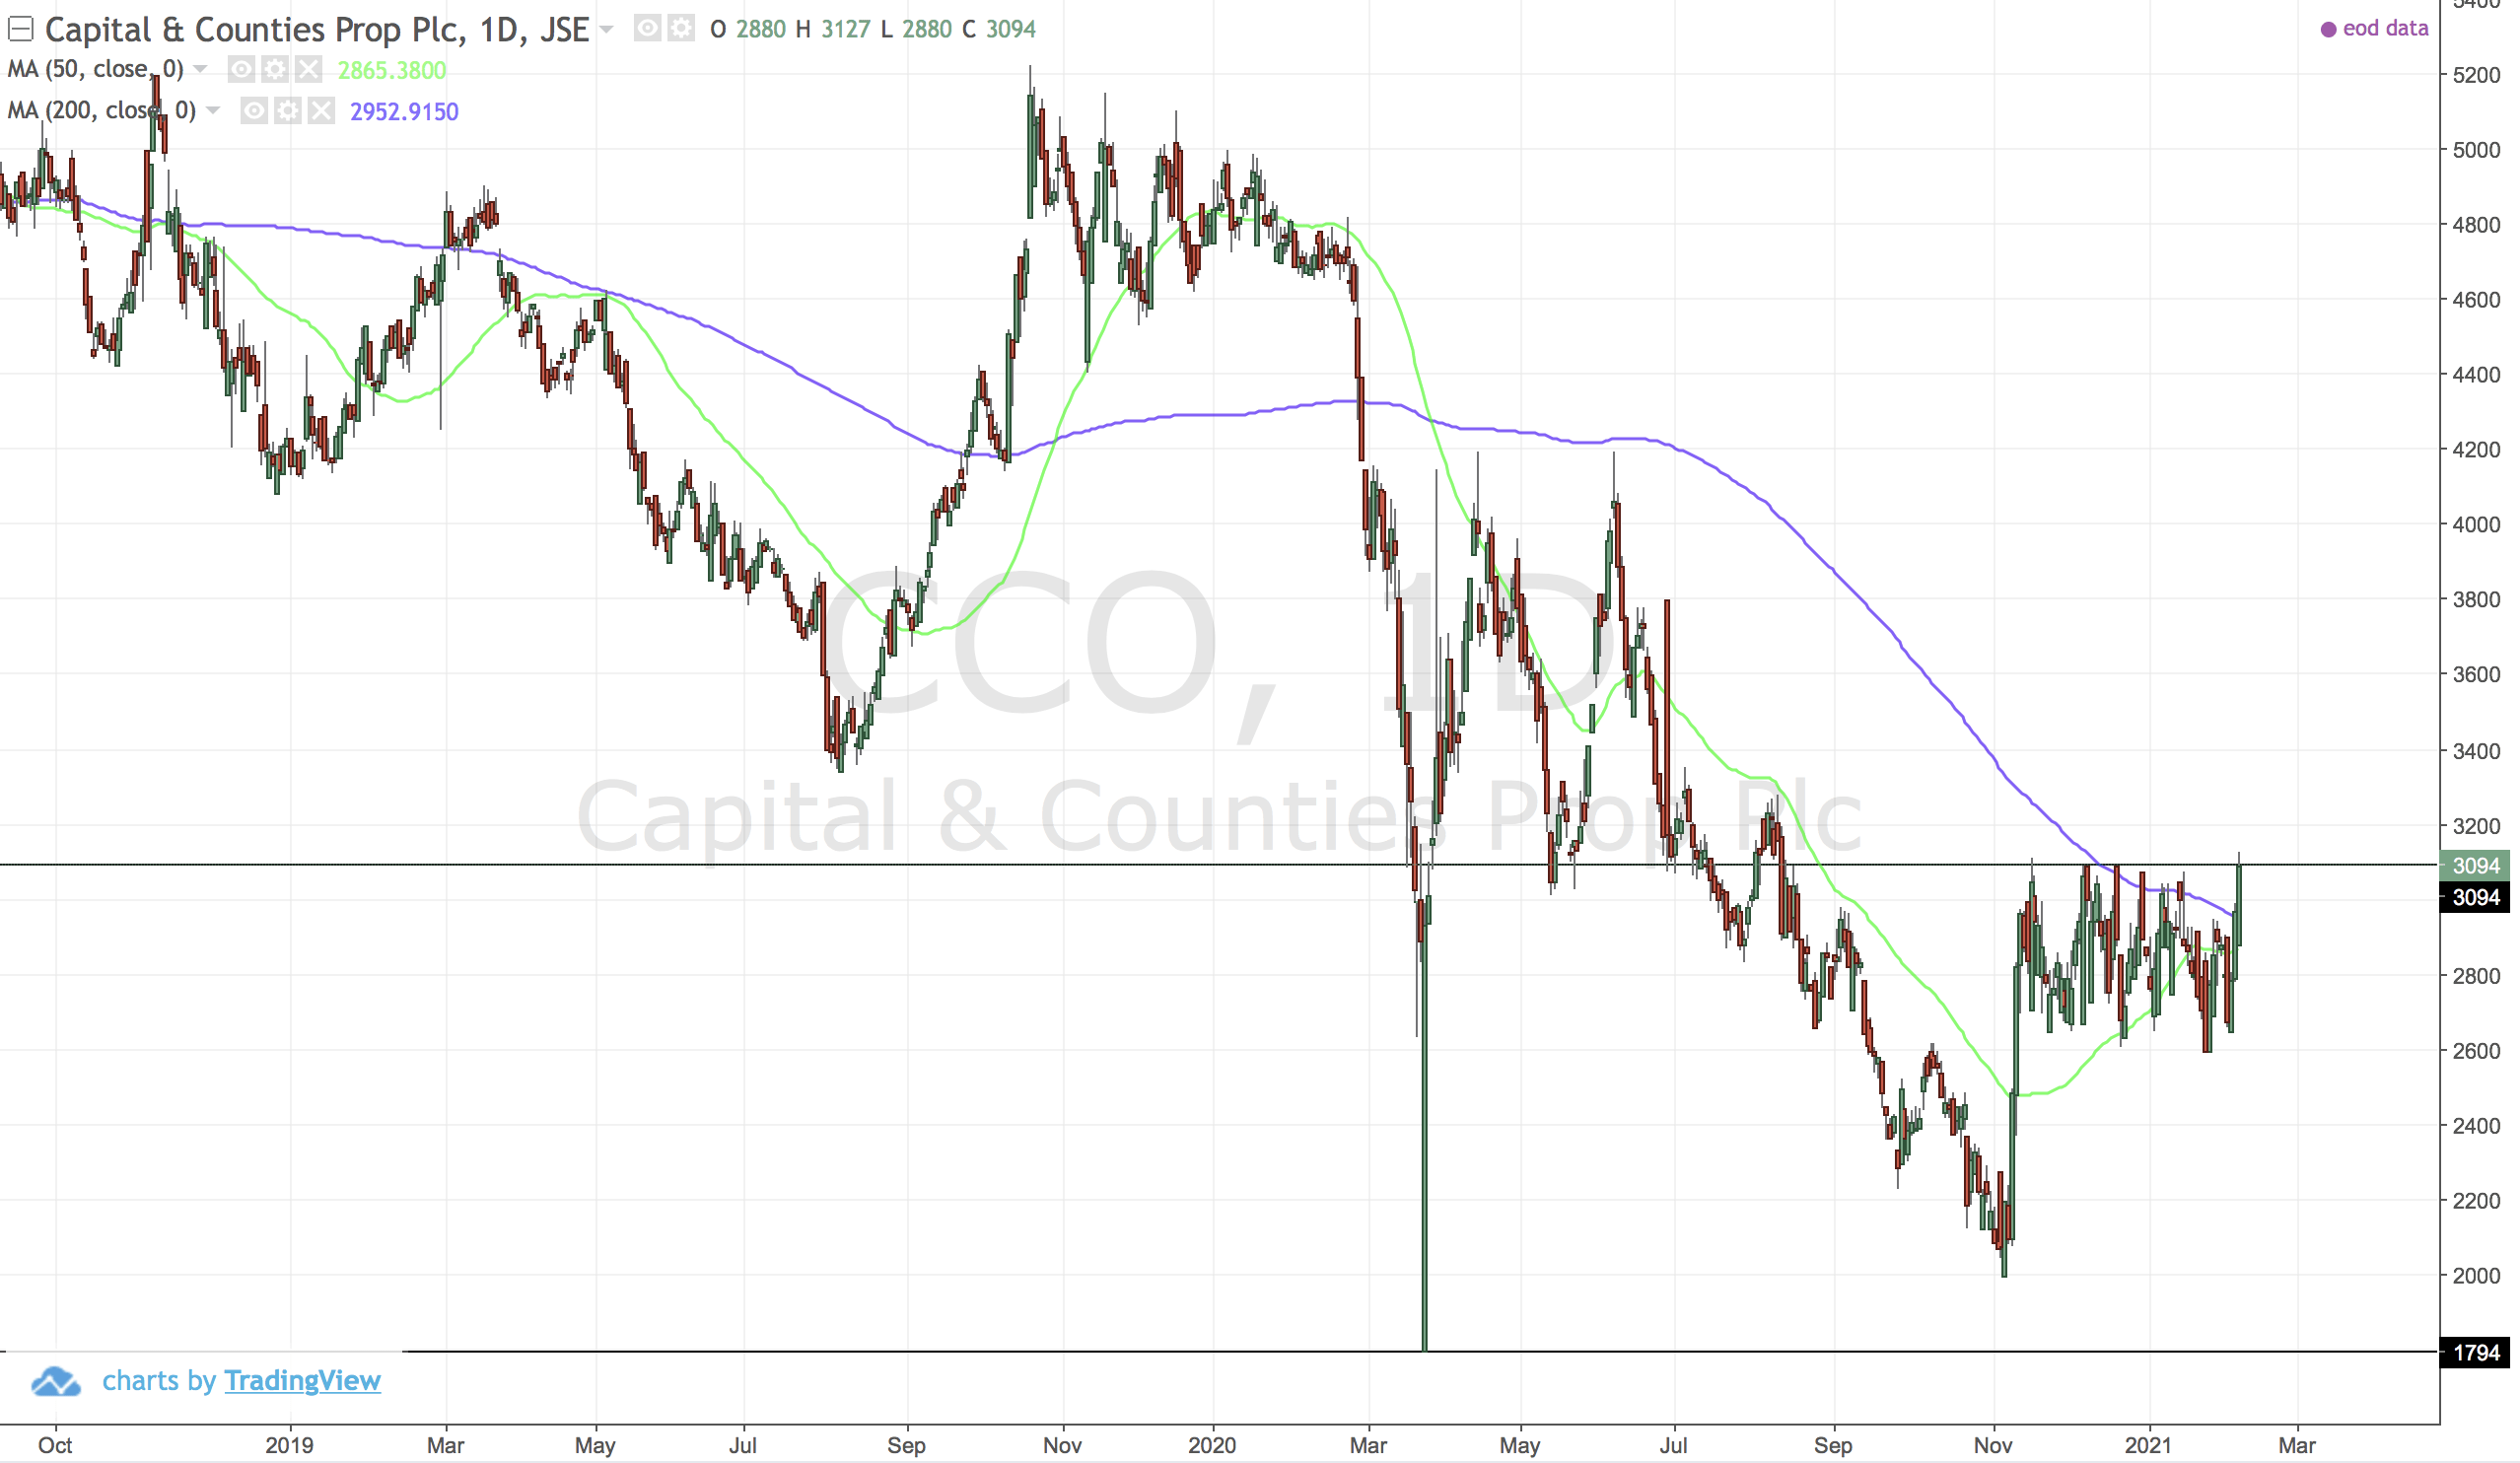
Golden cross incoming. We need a bot more evidence but the bottom might have just been locked in.
JSE:TKG (Telkom)
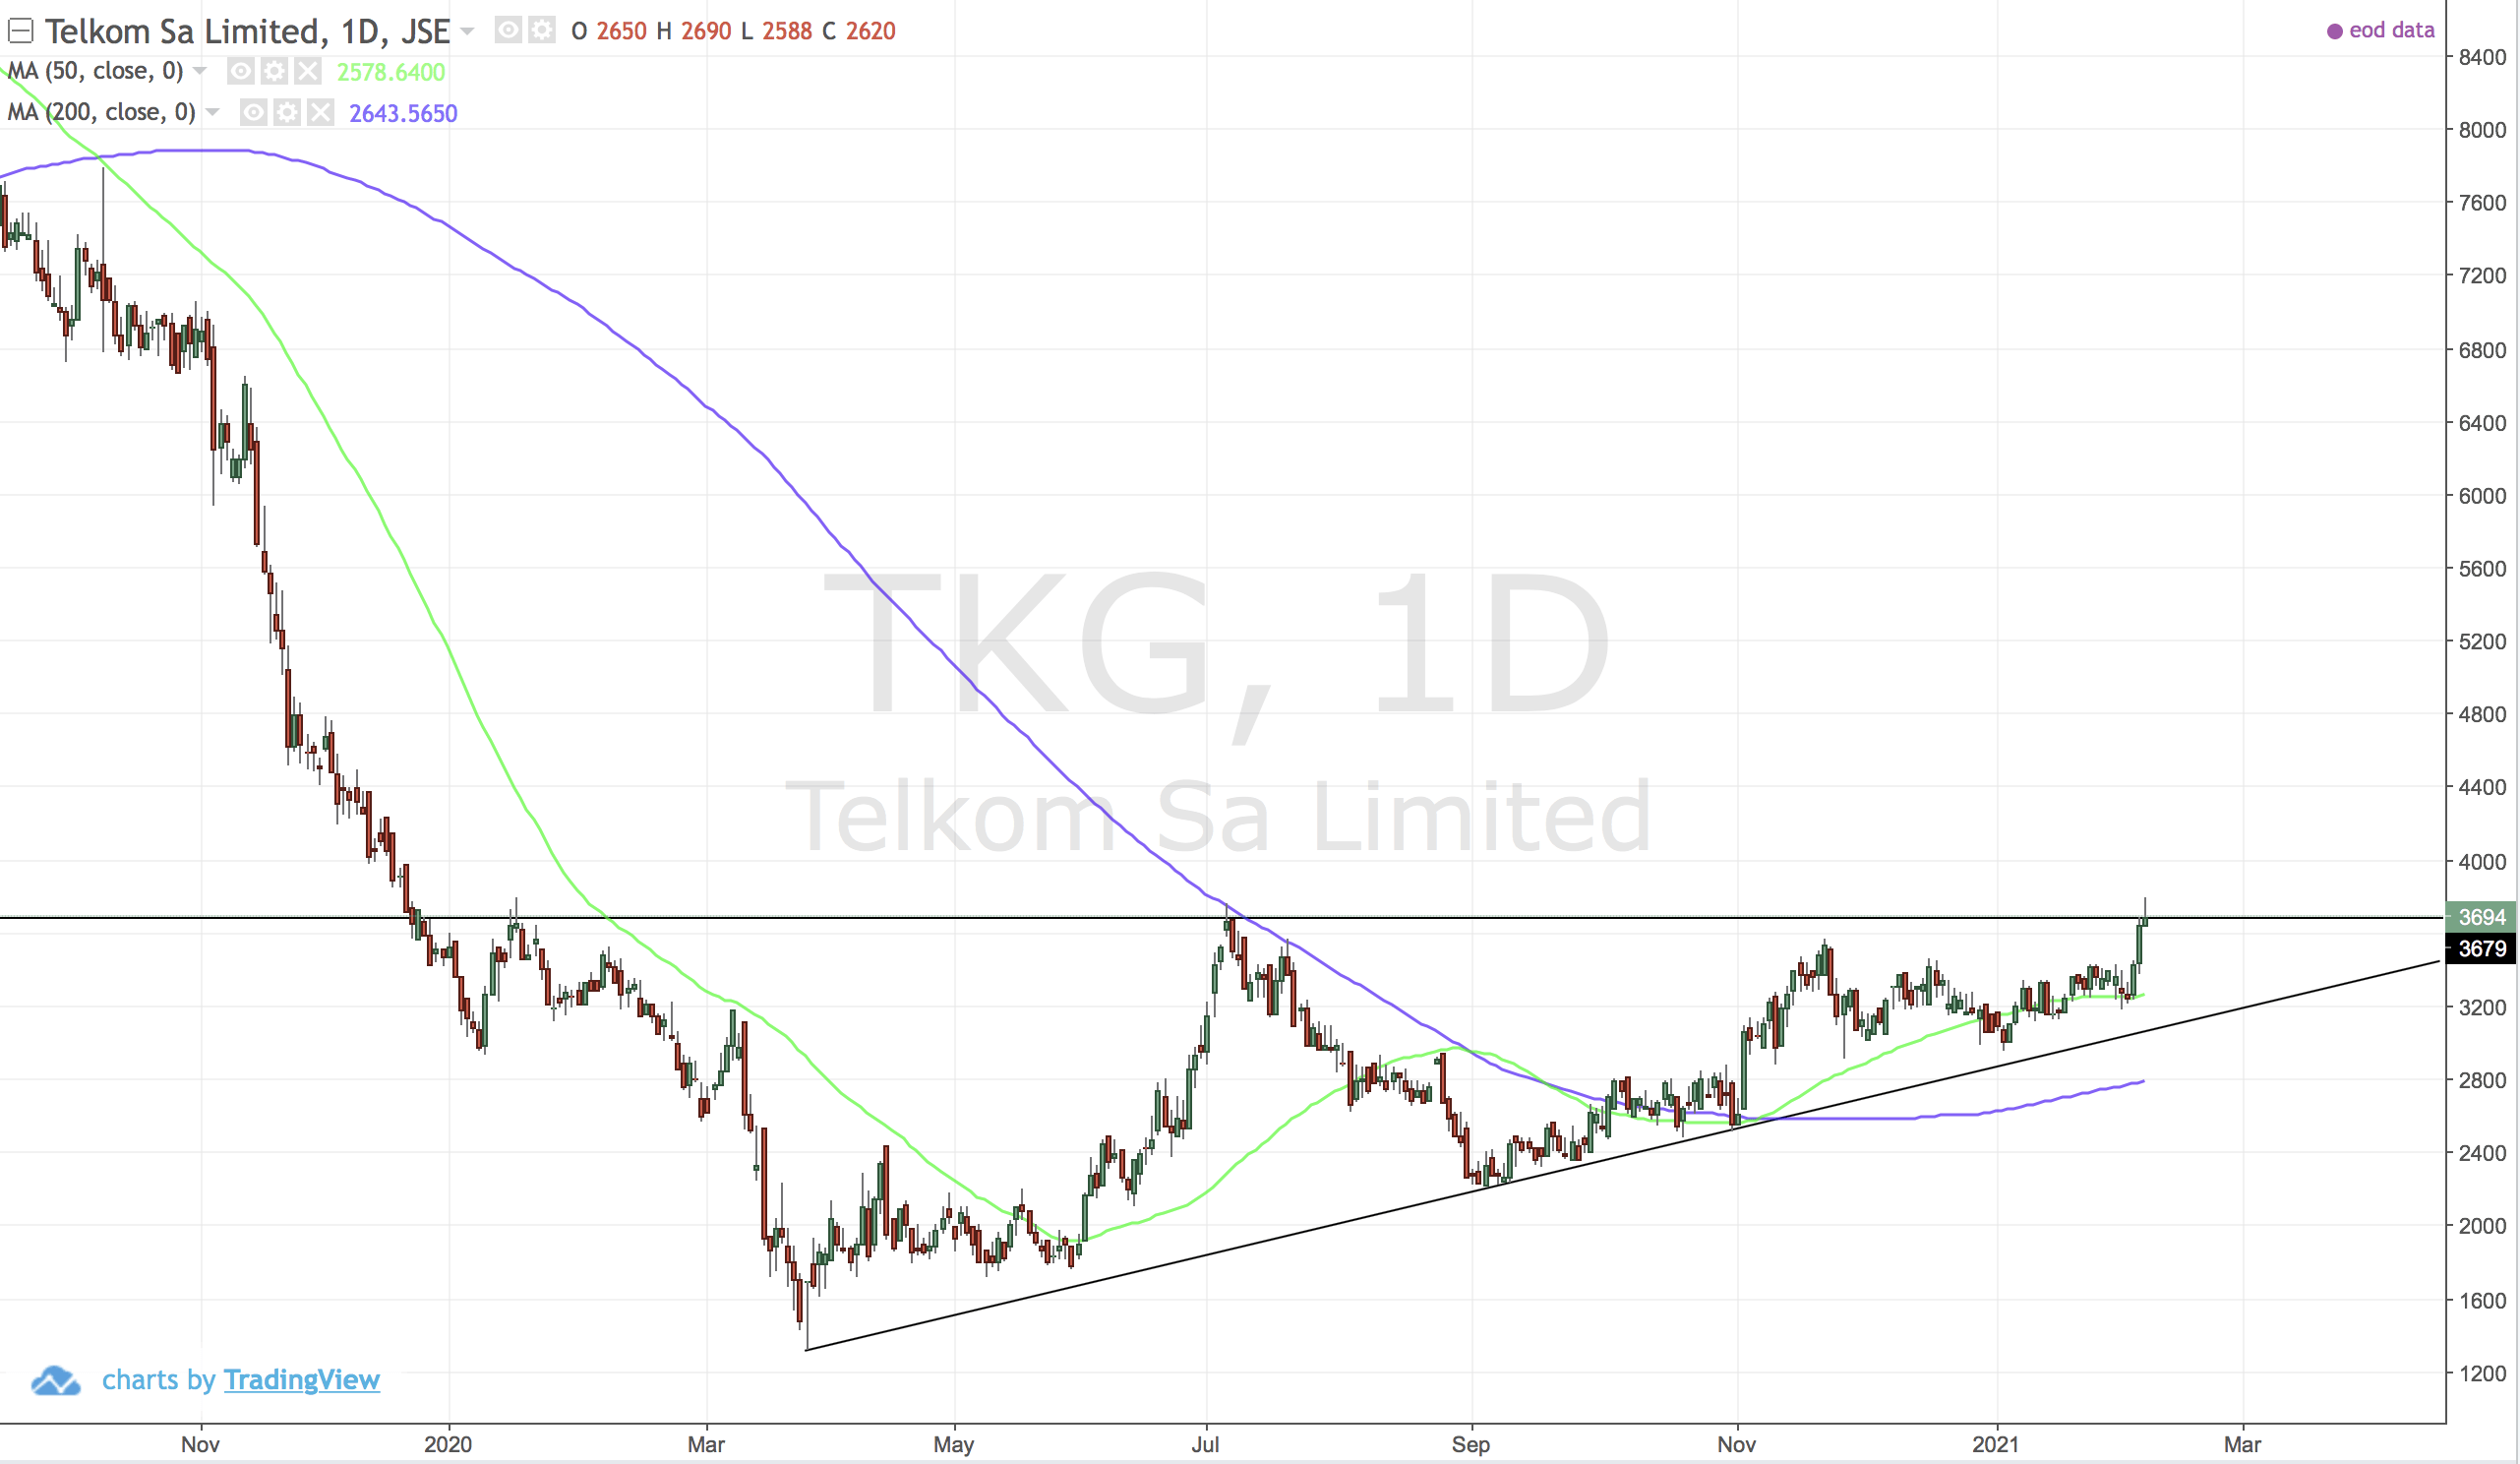
You know...yeah you know what good looks like.
JSE:STXFIN (Satrix FINI)
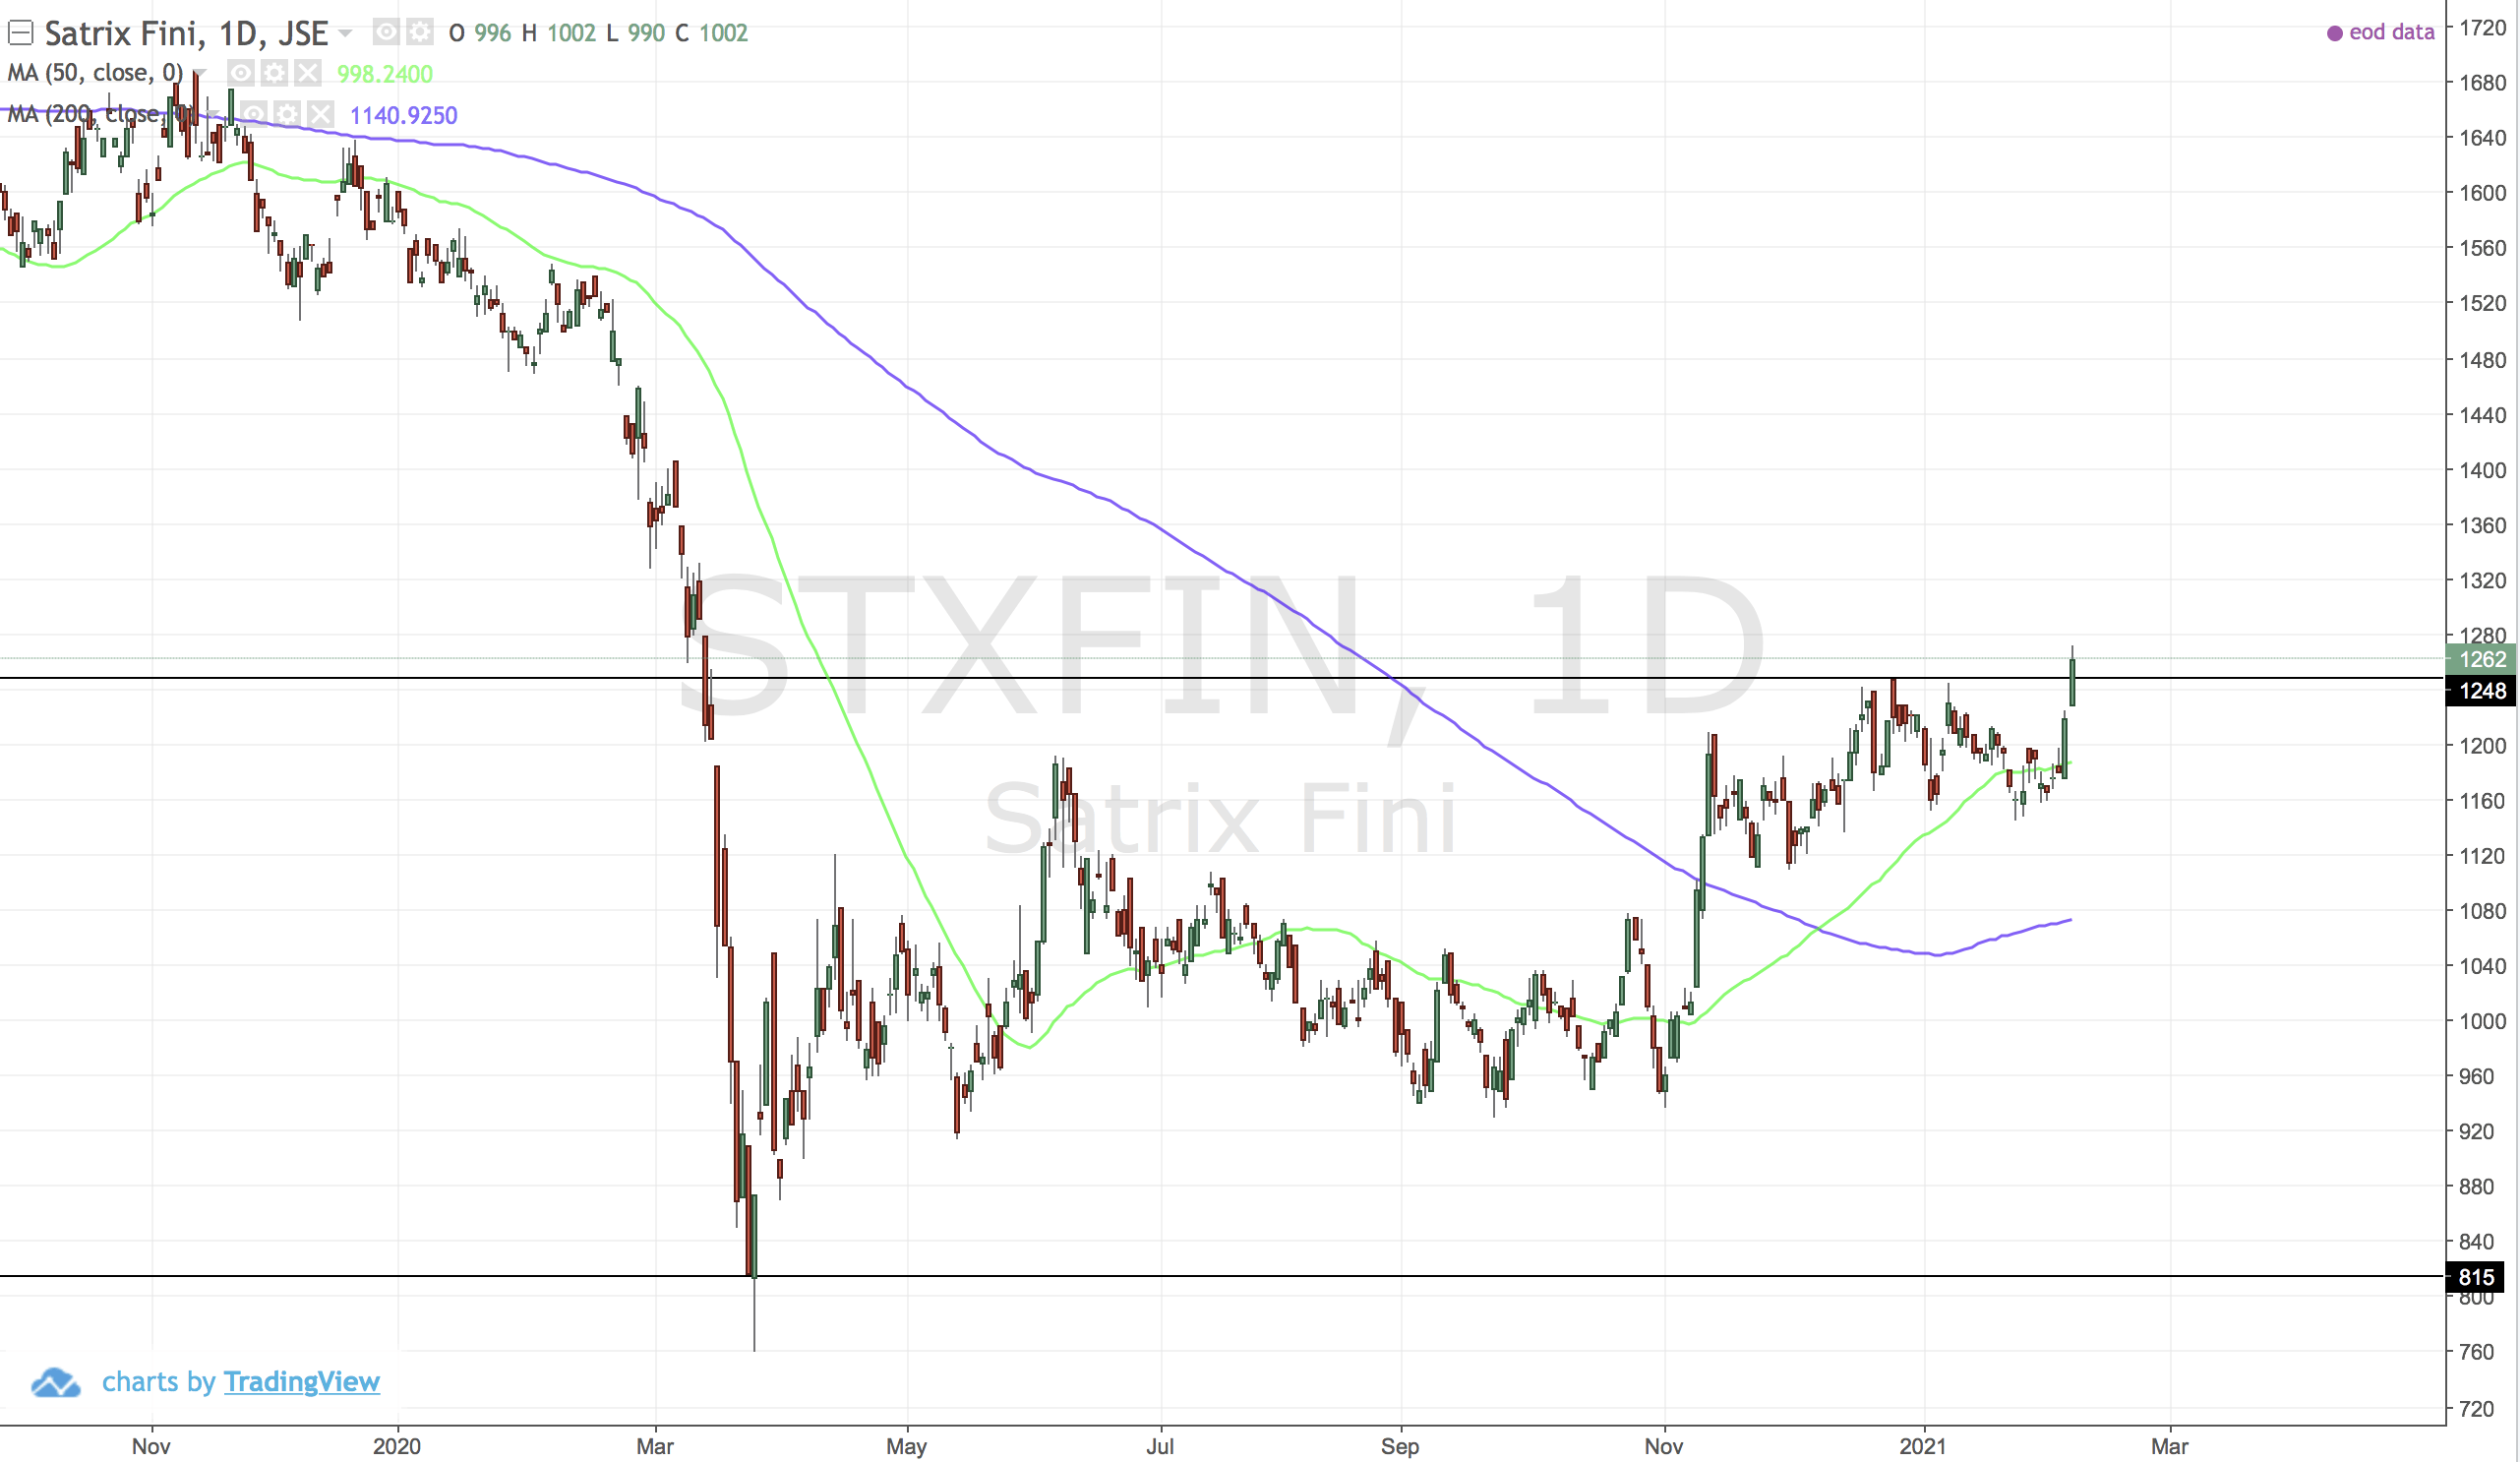
Dependent on USDZAR but this perpetual loser is now looking OK.
JSE:KAP (KAP)
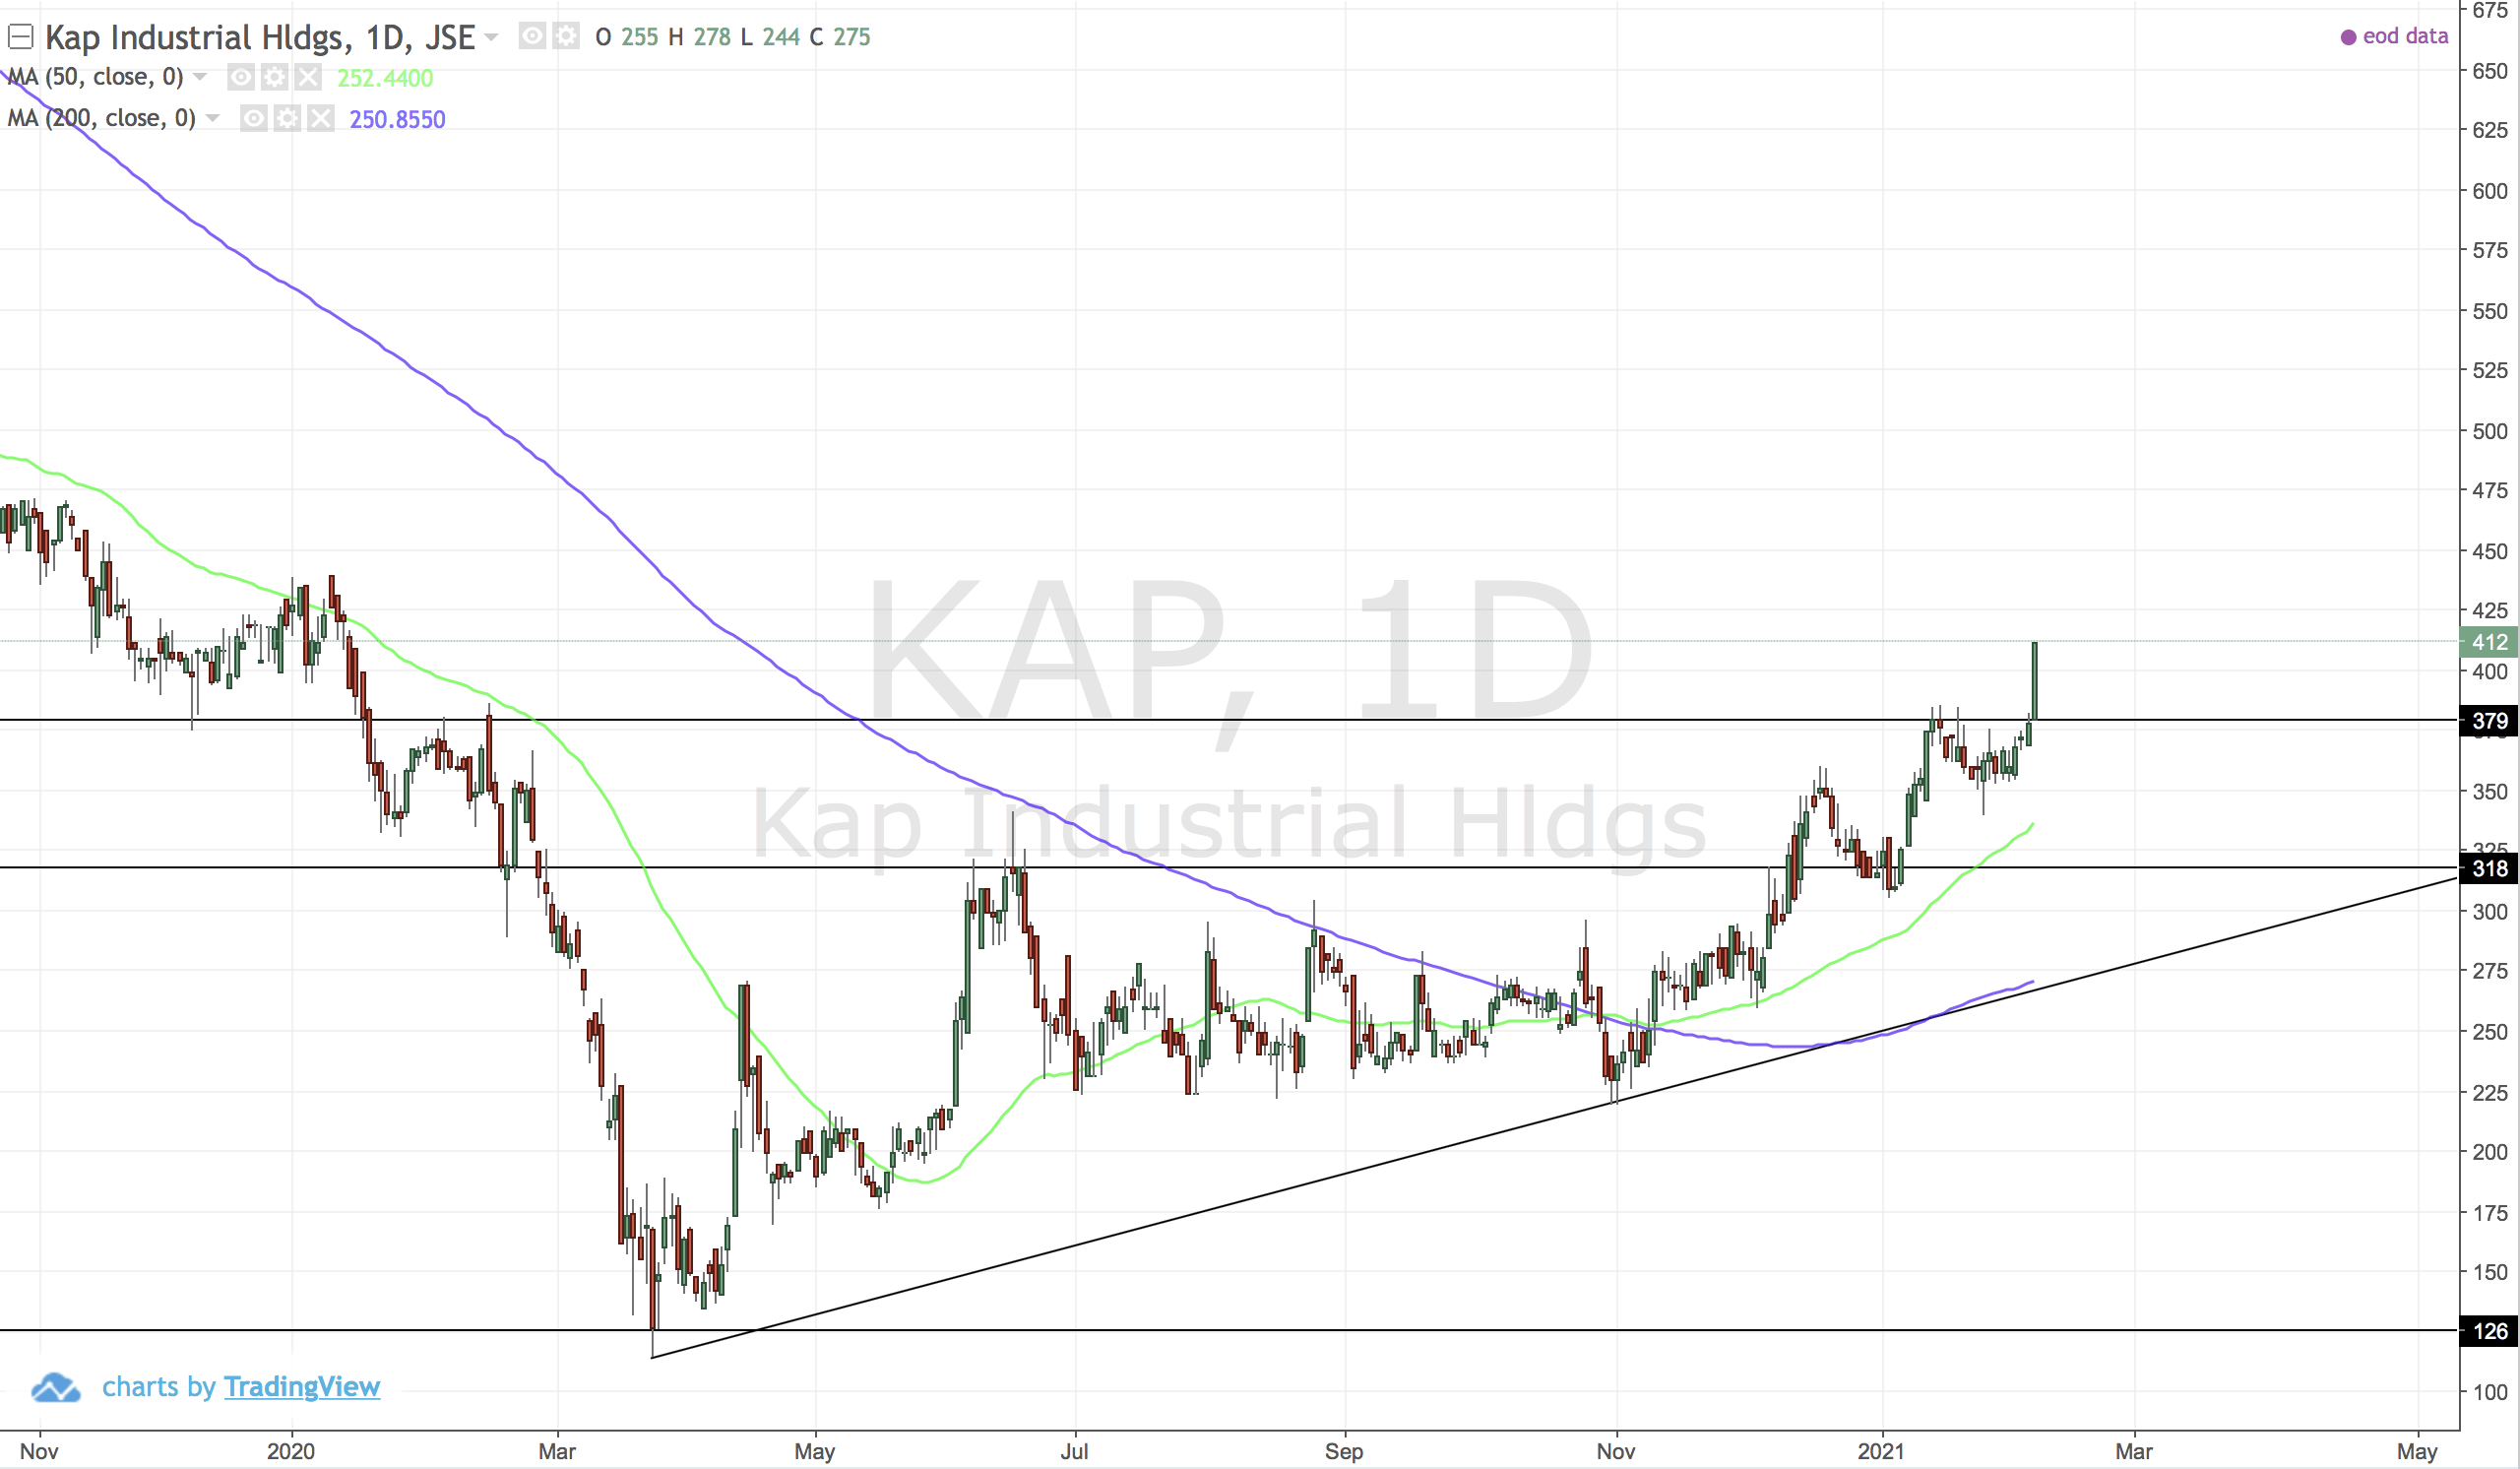
Looking excellent. Planned to buy but never triggered my entry - sometimes you just got to override and pull the trigger on the buy.
JSE:ABG (Absa)
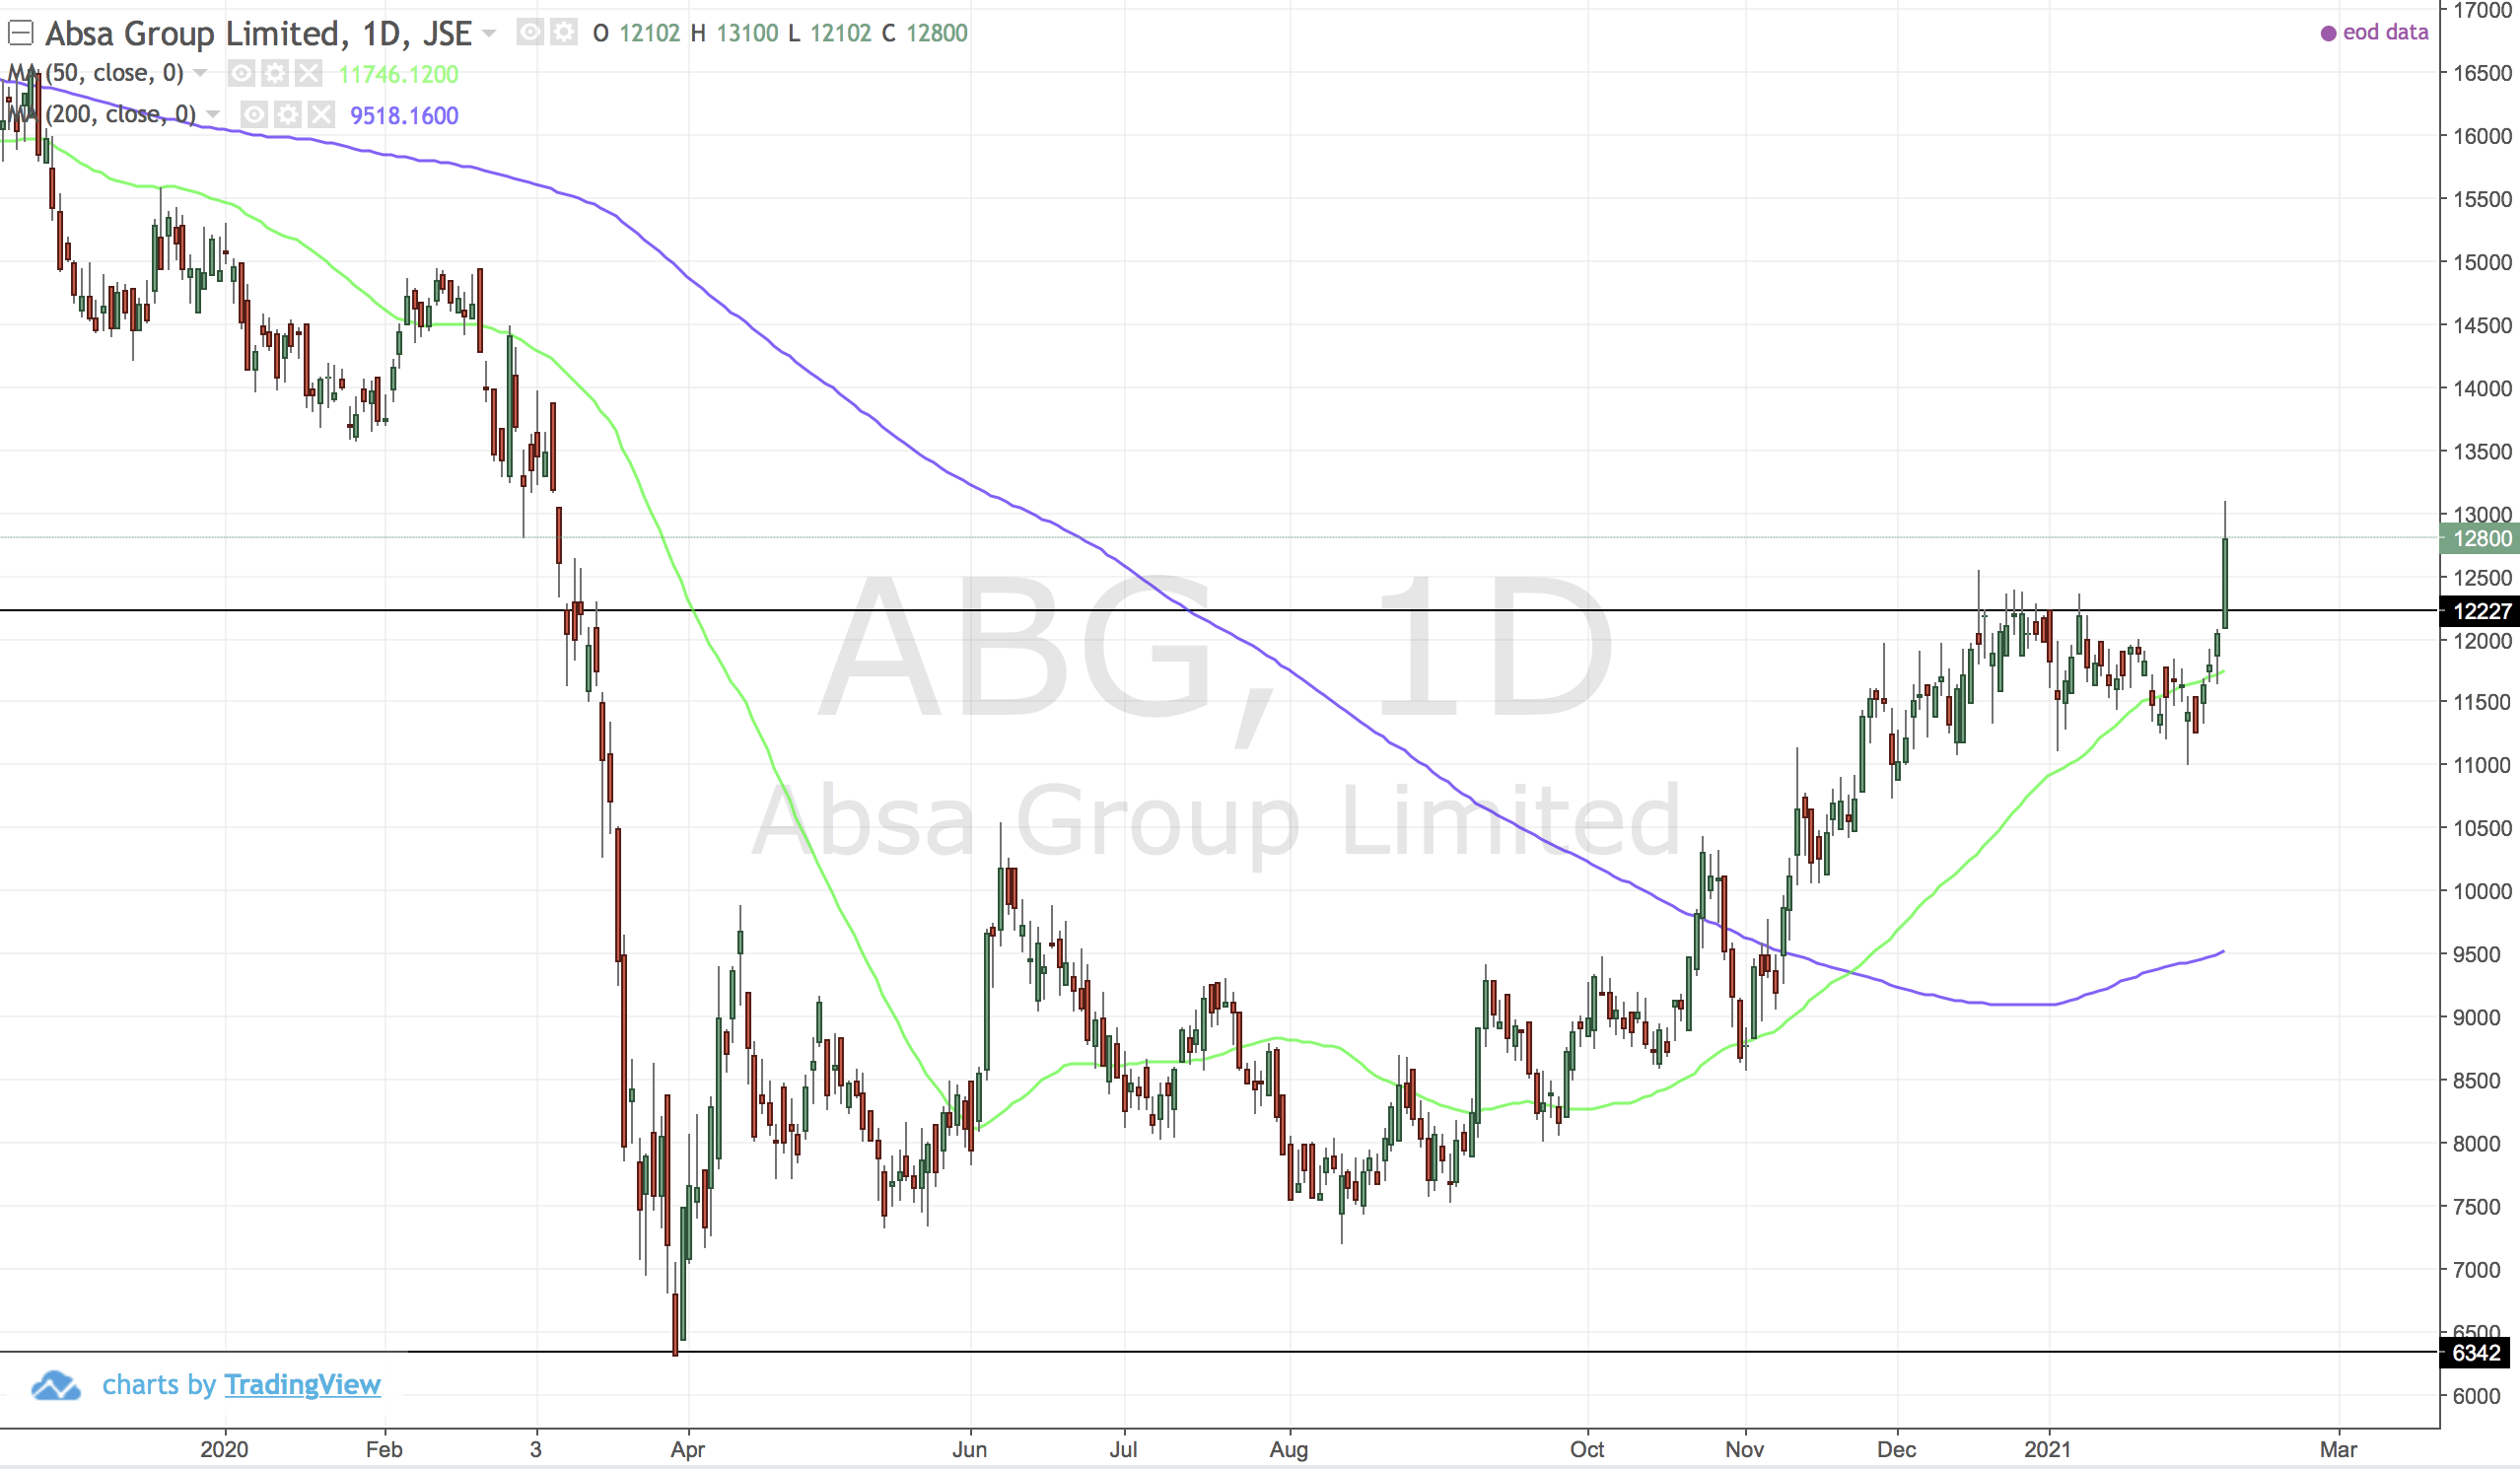
Same old story for many other financials...good. For now.
US Stocks
US:SHOP (Shopify)
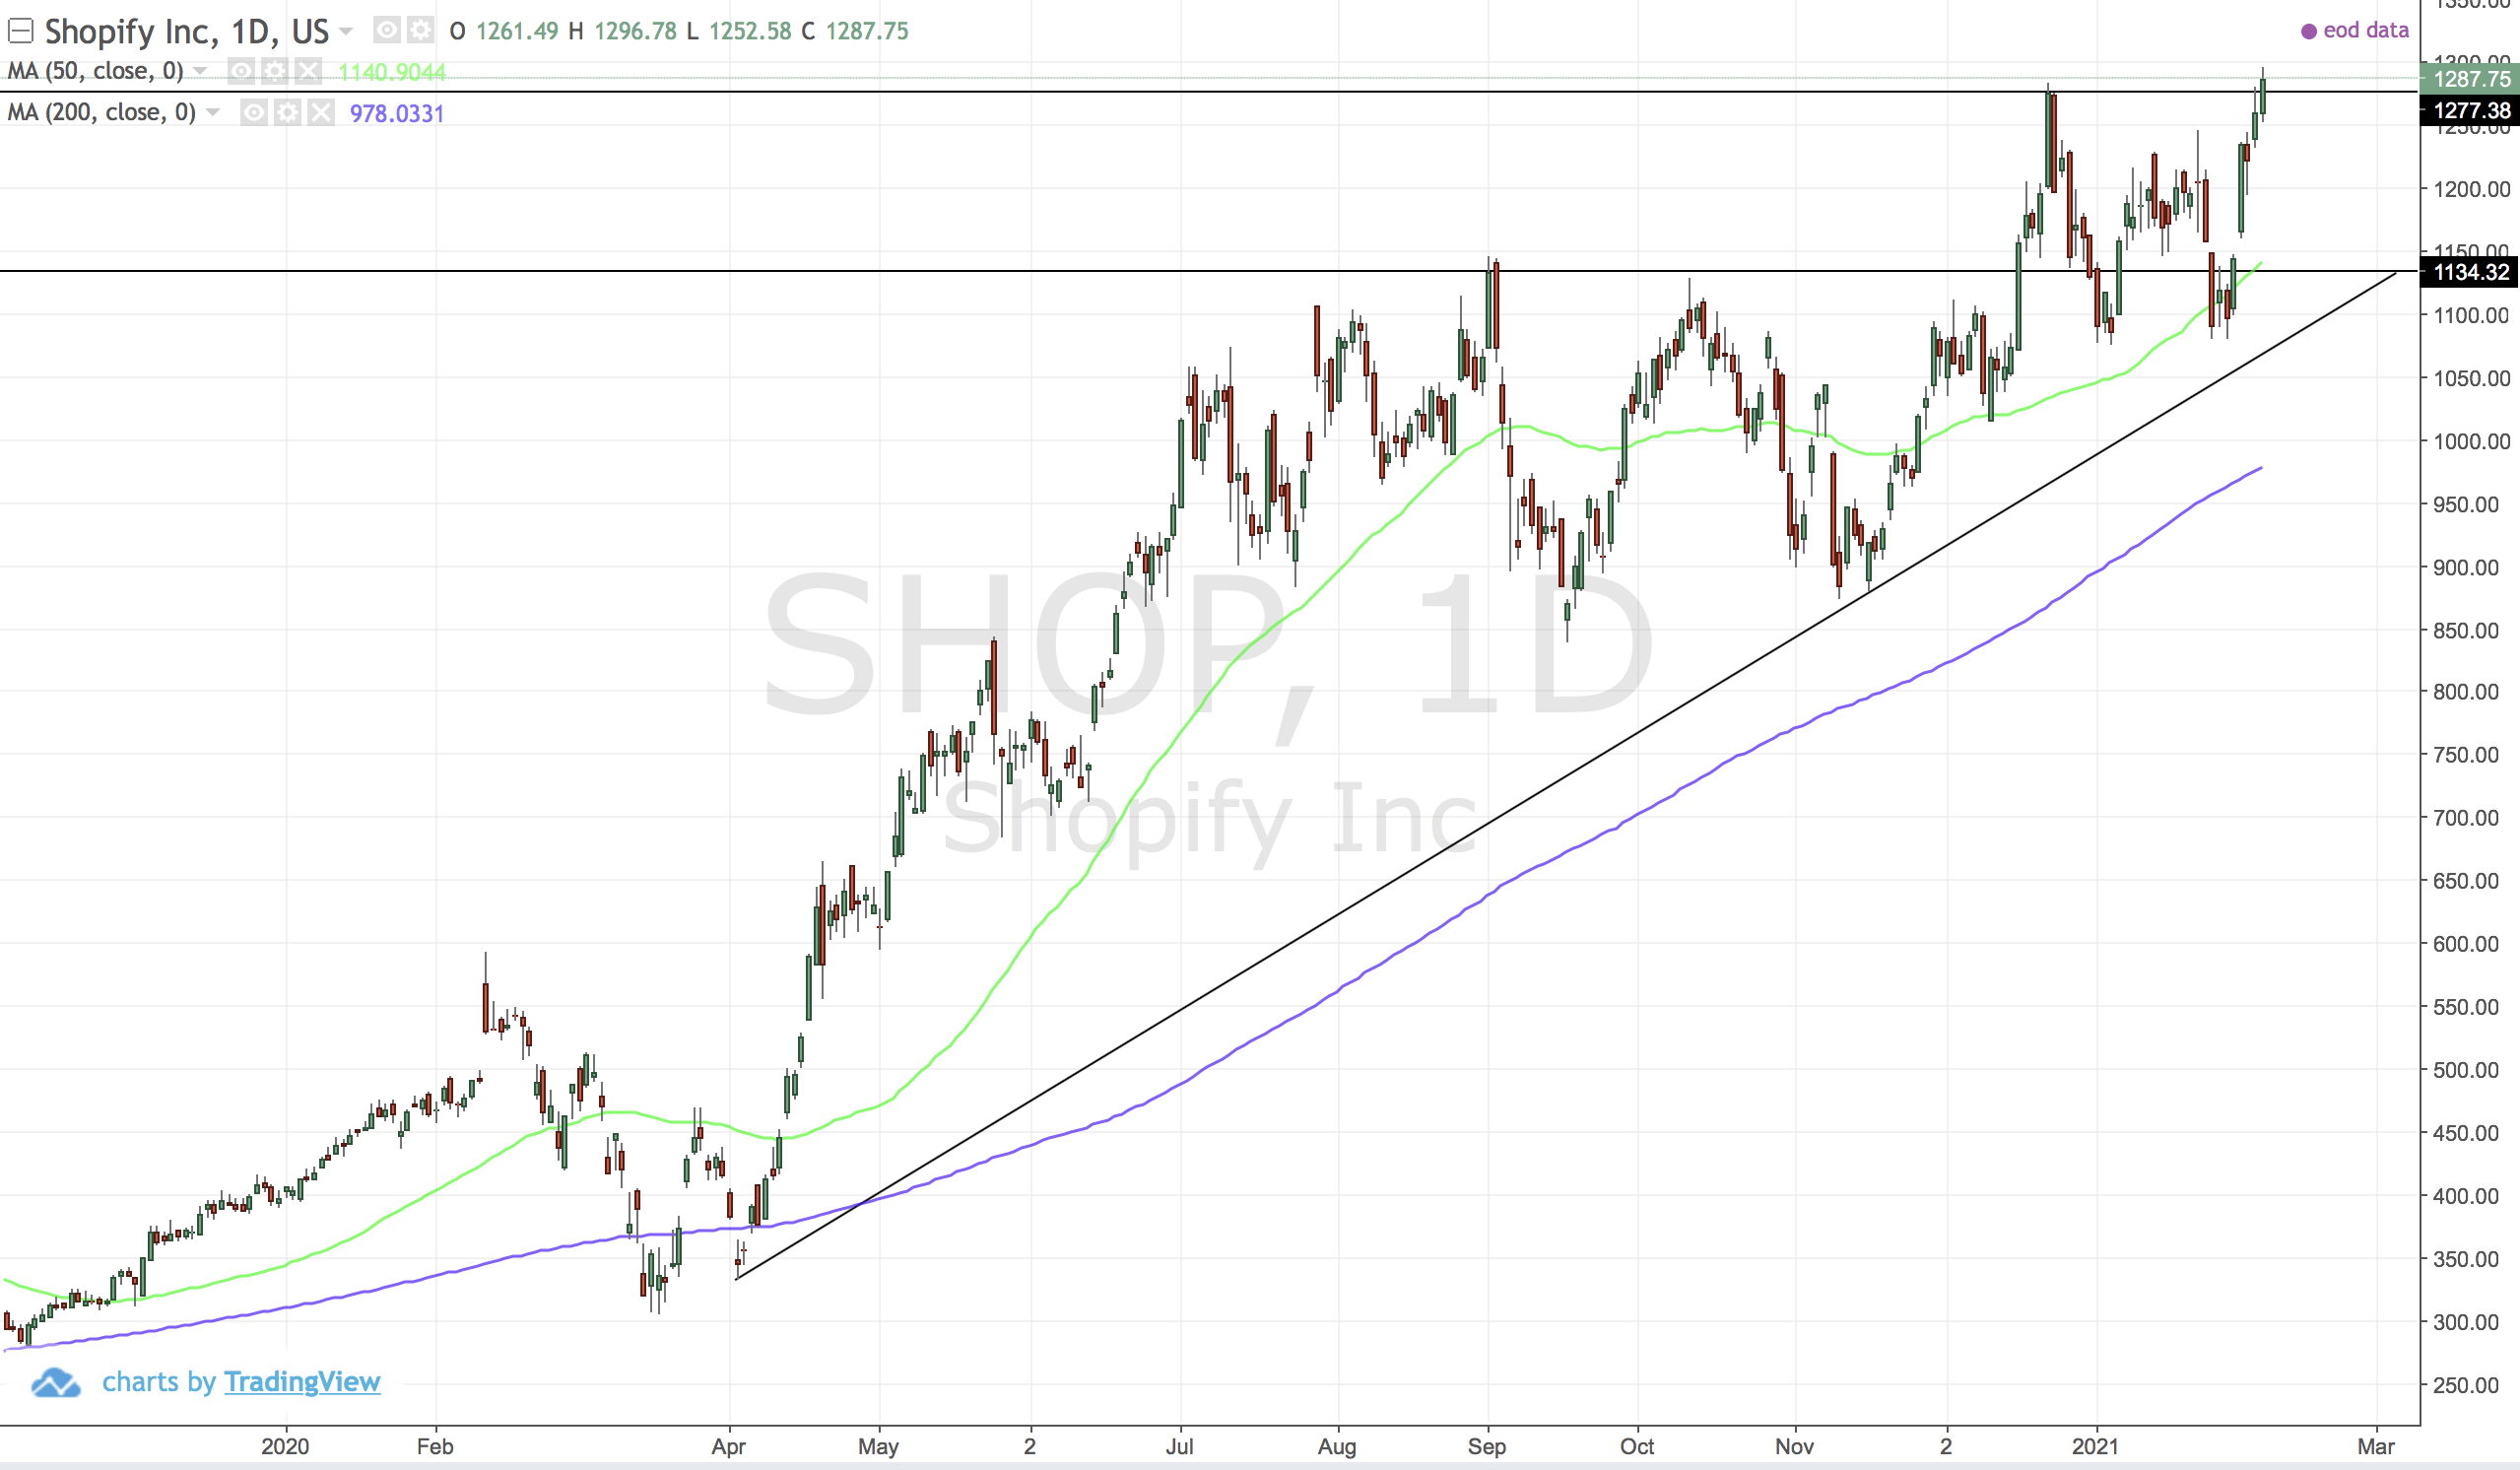
Break to a new high. The 200MA is looking a straight line to the sky.
US:EZA (iShares South Africa ETF)
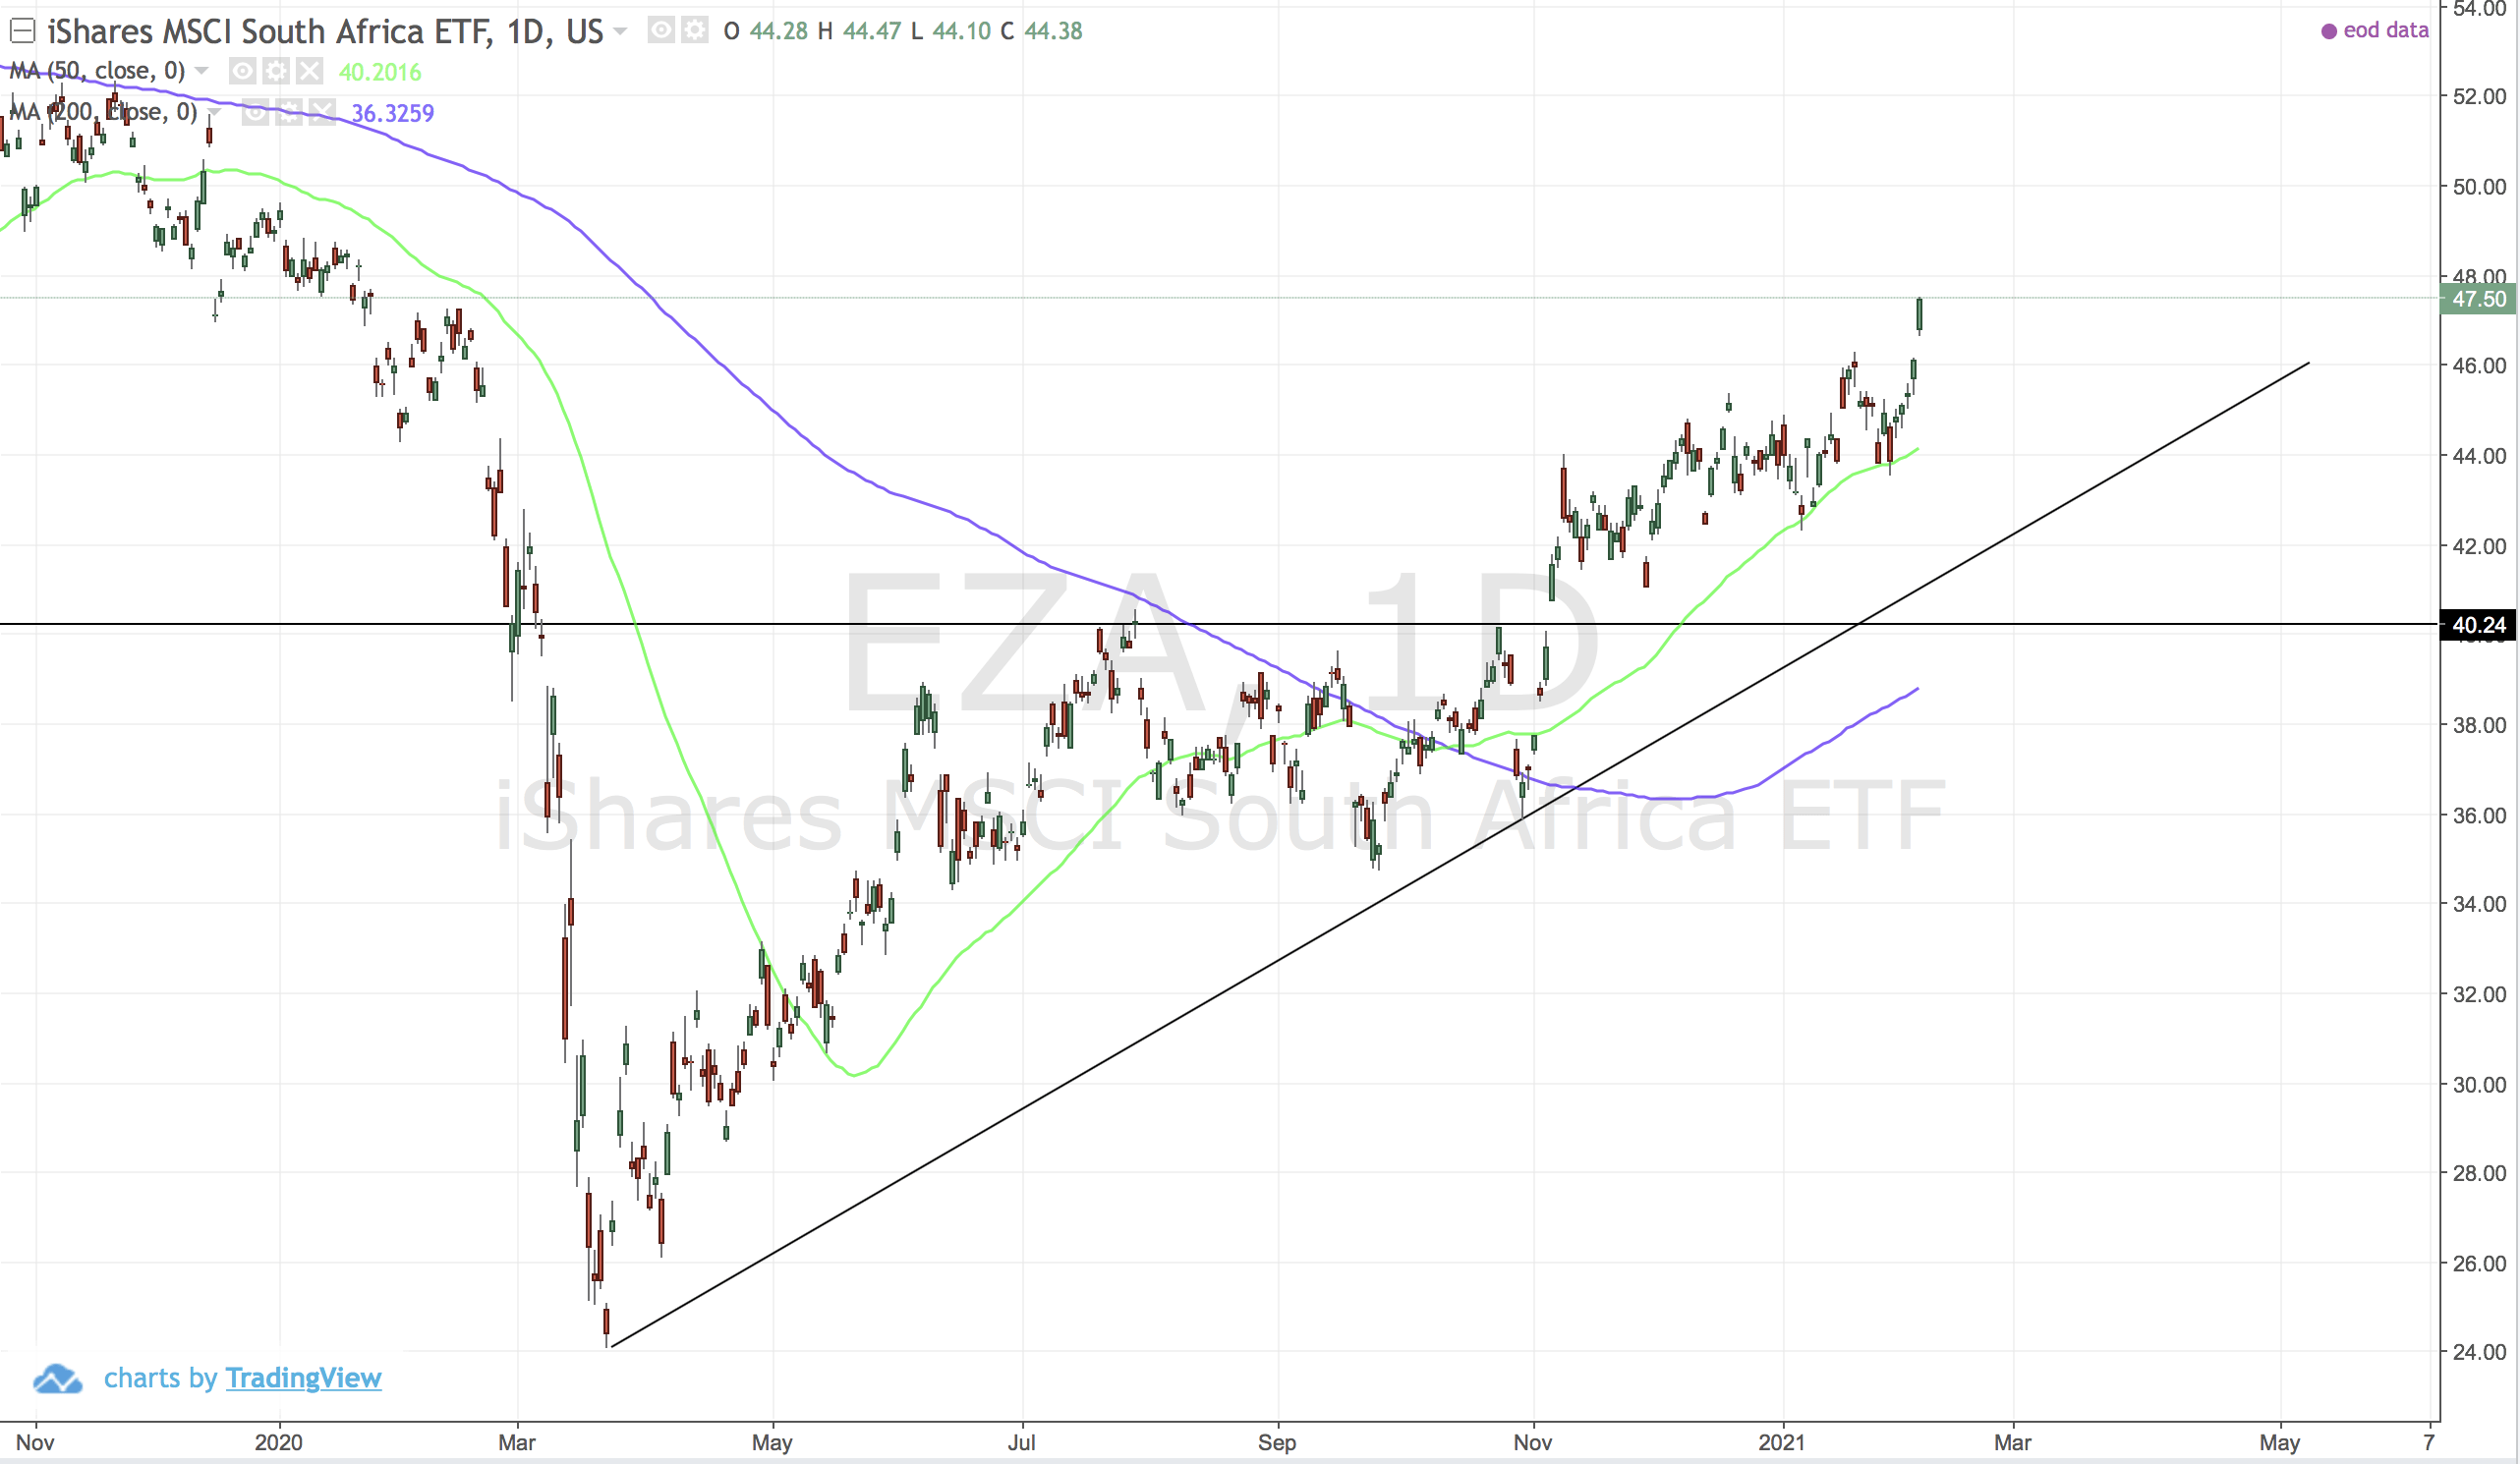
Looking from a US perspective - South Africa ETF not looking half bad.
US:RDFN (Redfin)
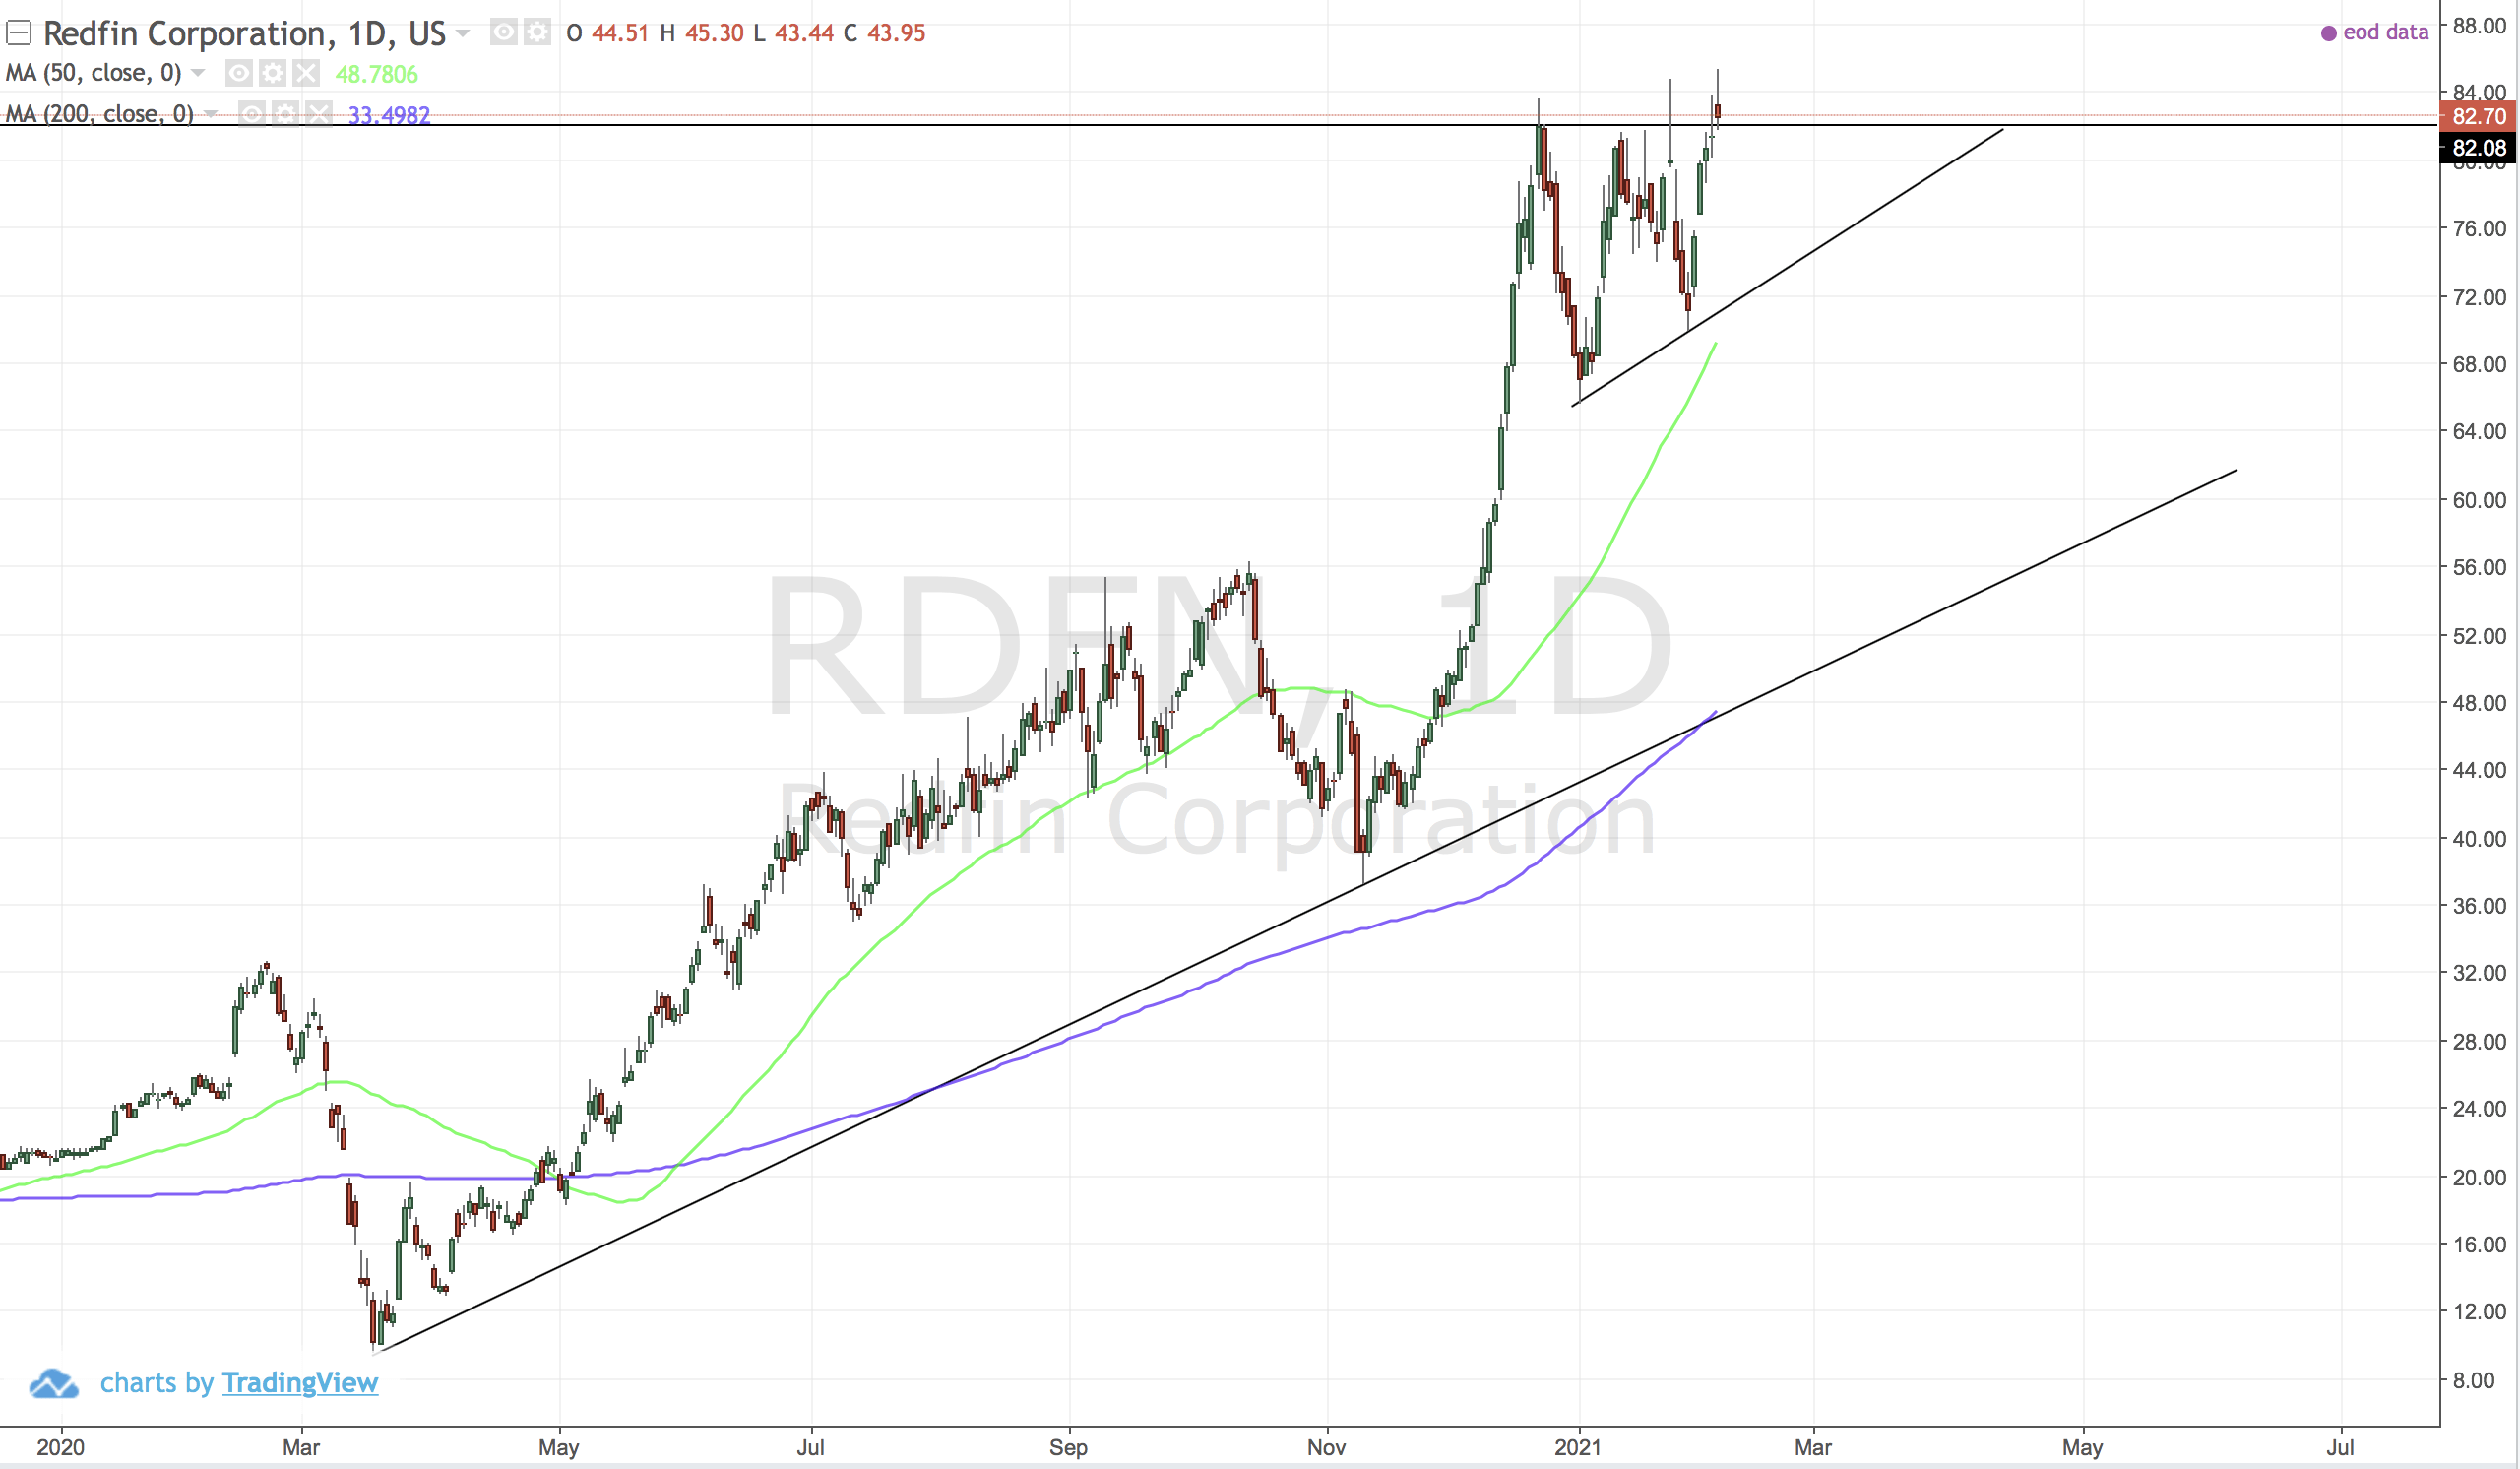
New high locked in.
Want to Analyse charts yourself?
Get access to over 2000 indices and stock charts available on Easy equities. Set breakout levels and be alerted when a stock you are watching breaks out.
Only R300 for 1 year (R25 a month). The trial is free for 1 month without a credit card requirement.
Check out How-to-trade.co.za now!
Comments ()