Some Recent Breakouts
Village Trader looks at 6 JSE stock breakouts

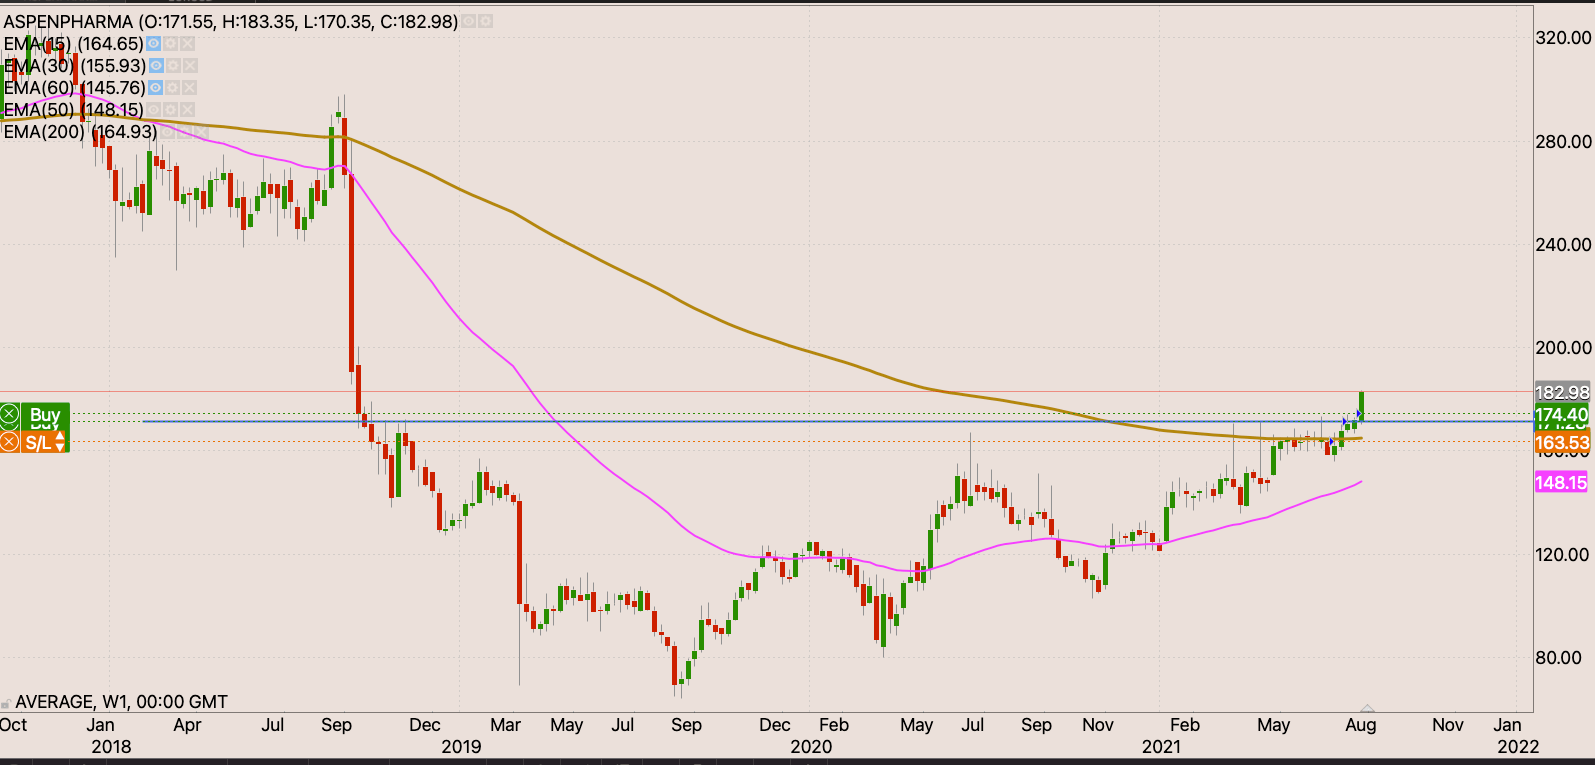
Aspen
Weekly chart.
Nice looking base chart pattern. The stock is holding above the 200 week EMA. The buyers have taken the R177 (high since October 2018). We could see the stock run to R319 (+85% from current level). Aspen looking like a jam
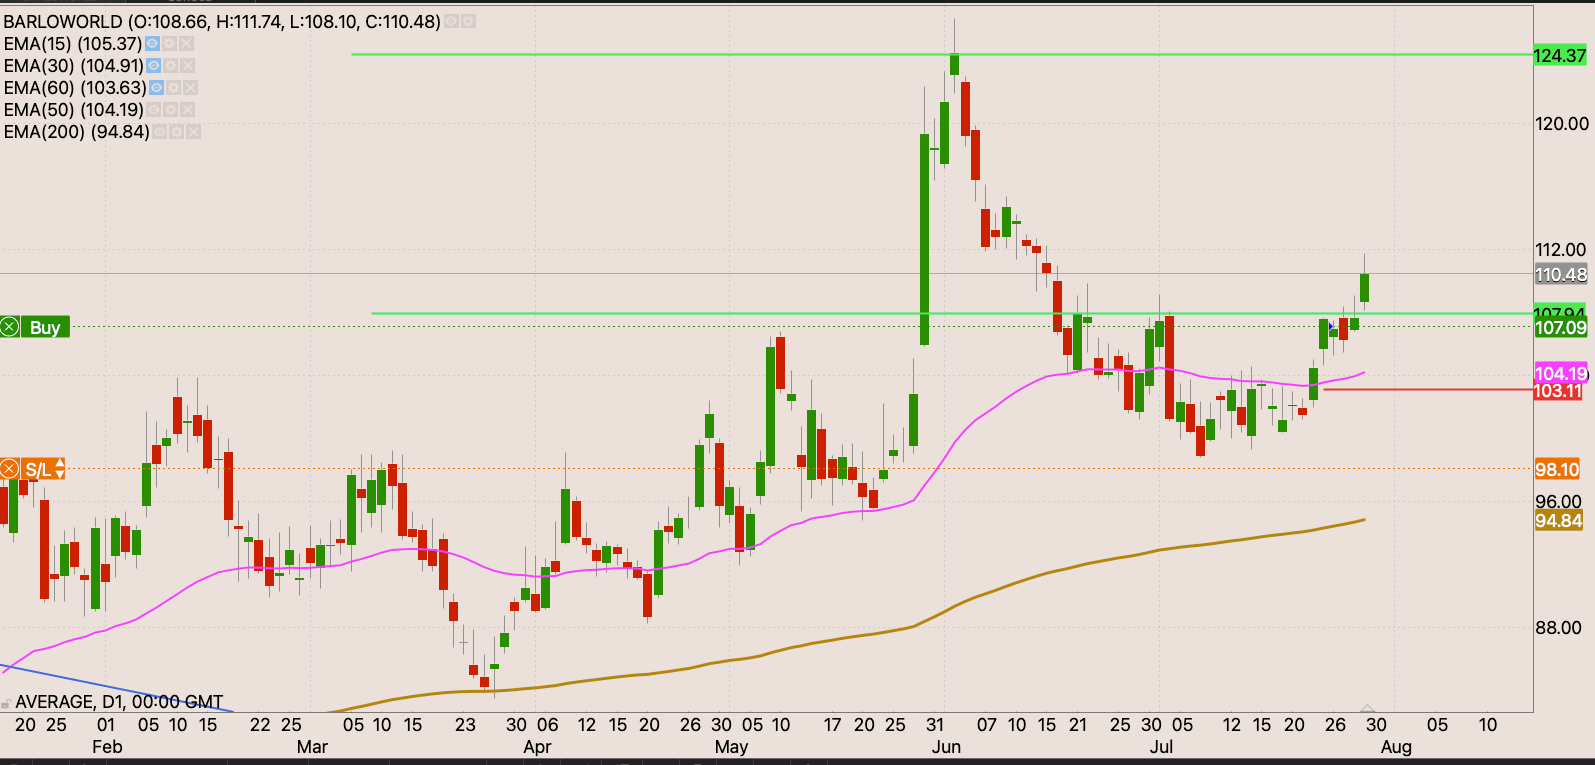
Barloworld
Daily chart.
The stock takes out the R107 resistance. Looks like $BAW is on the go.
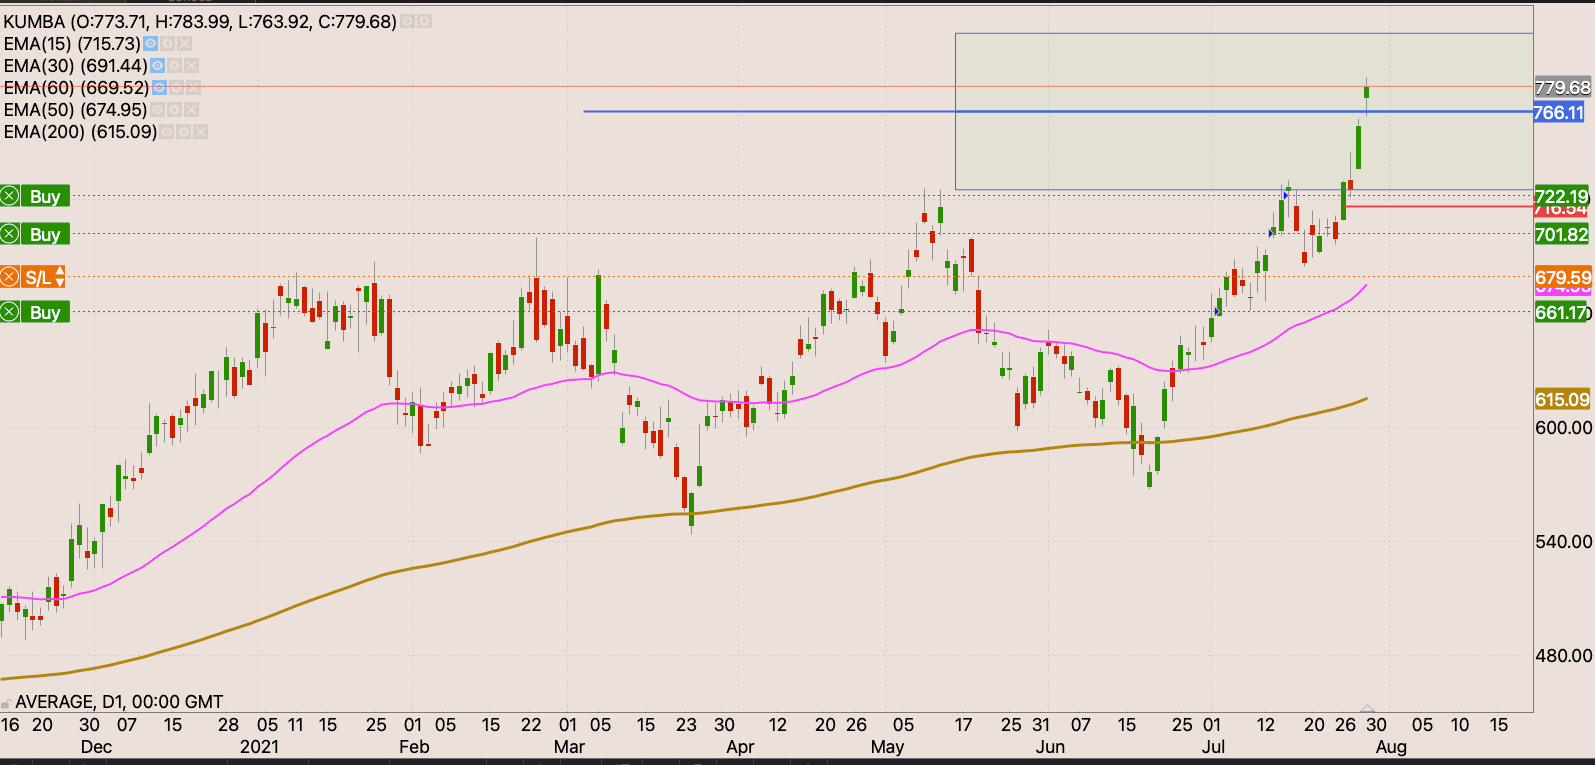
Kumba
Daily chart.
New highs territory.
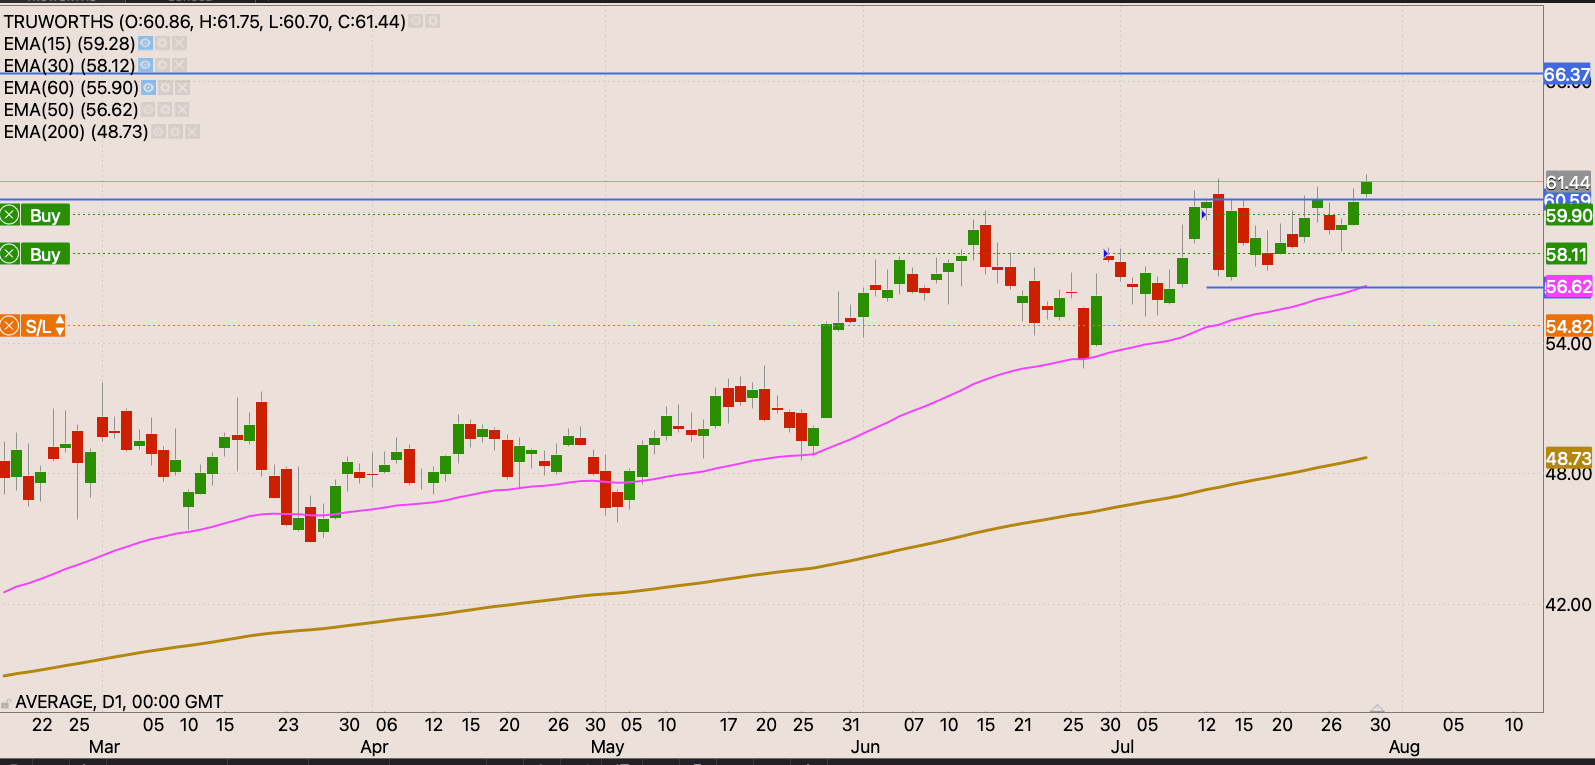
Truworths
Daily chart.
Not to be left behind, Truworths also joins the party taking out multi year highs.
Impala
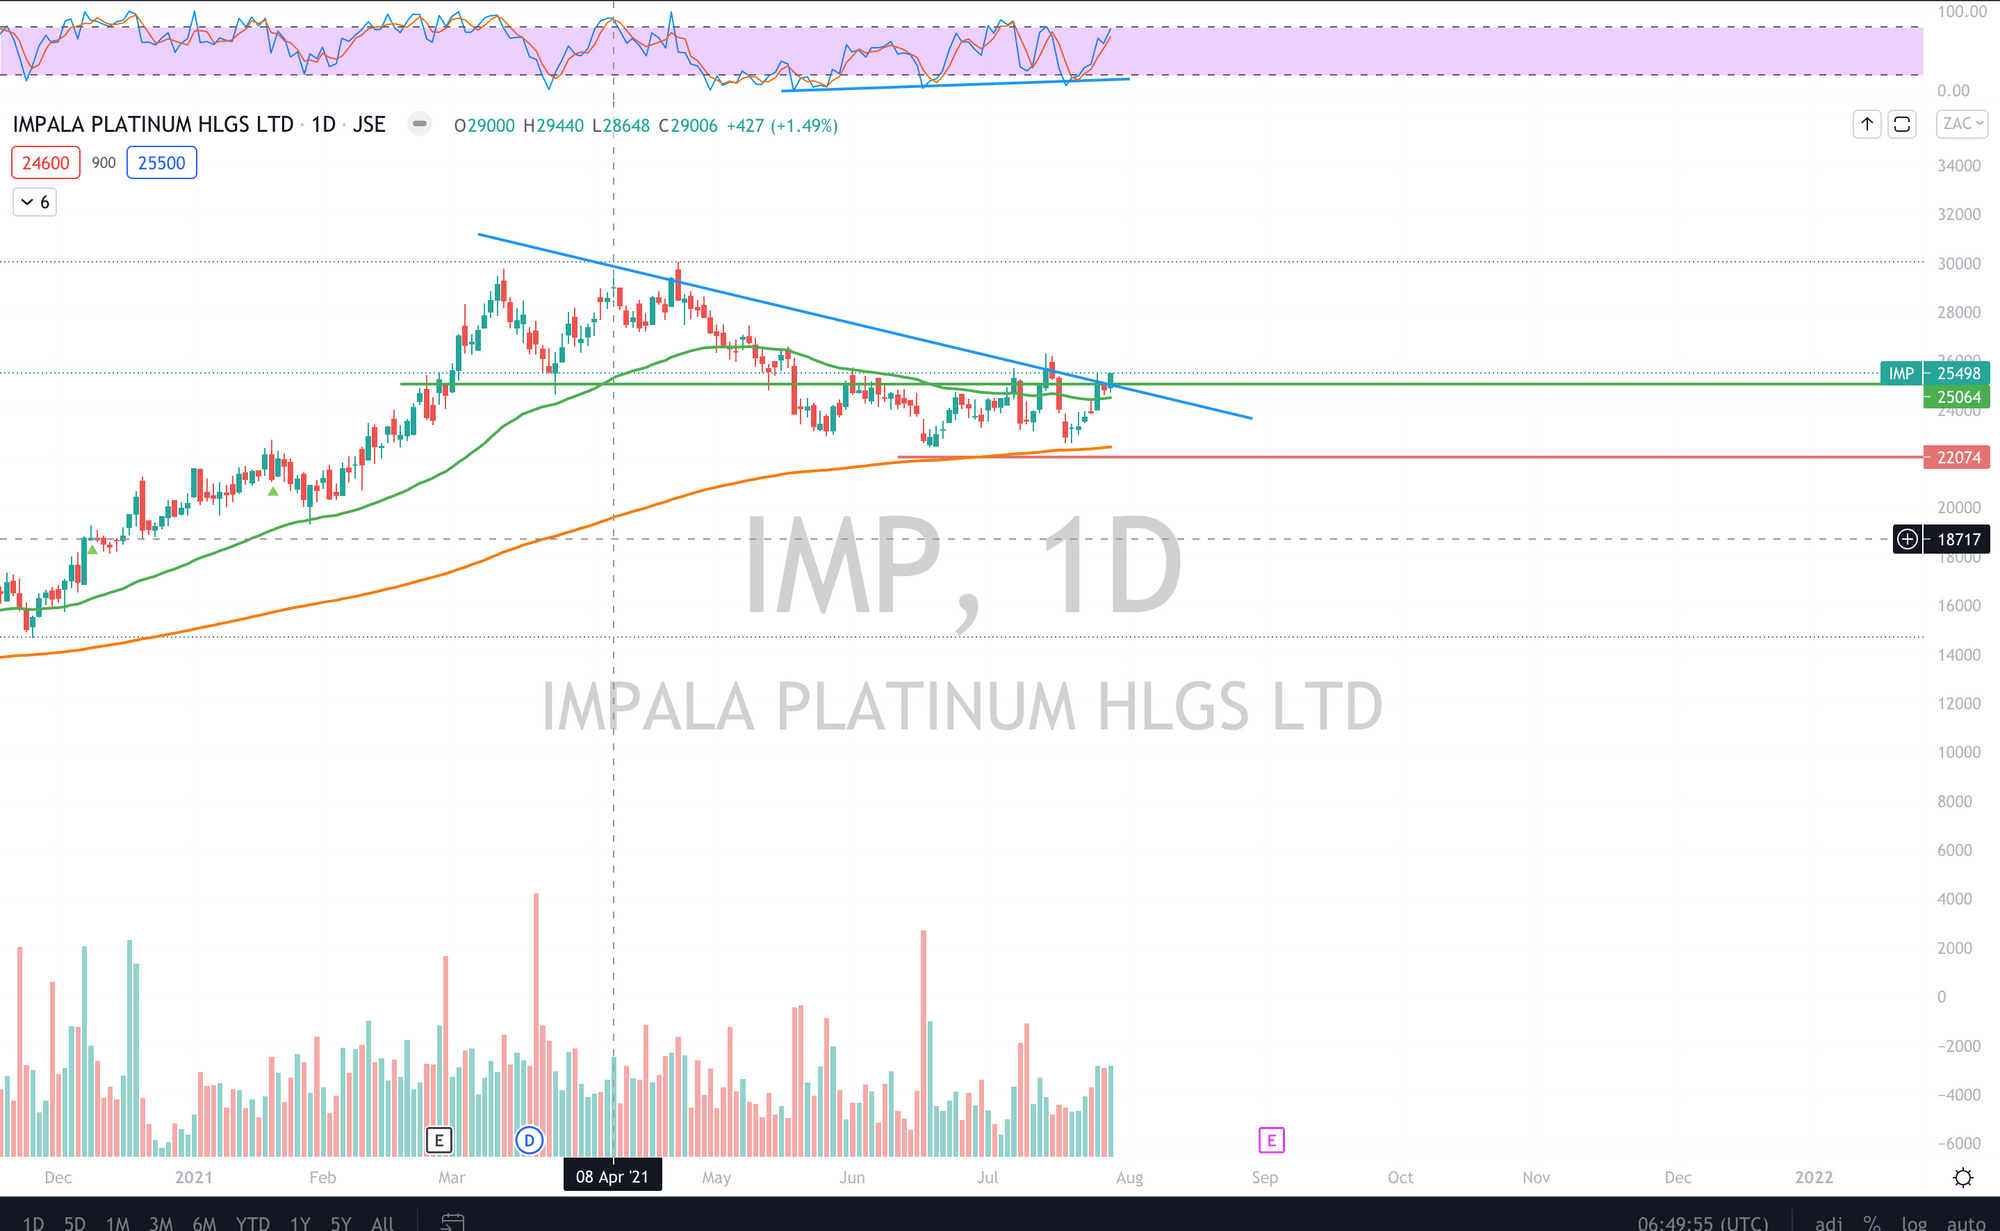
Daily chart.
IMP breaks the medium term downtrend resistance line. After holding strongly both the 50 day EMA and the 200 day EMAs. continuing rand weakness should further support the stock.
A good buy with a stop loss just below the 200 day EMA around the R220 level.
Mr. Price
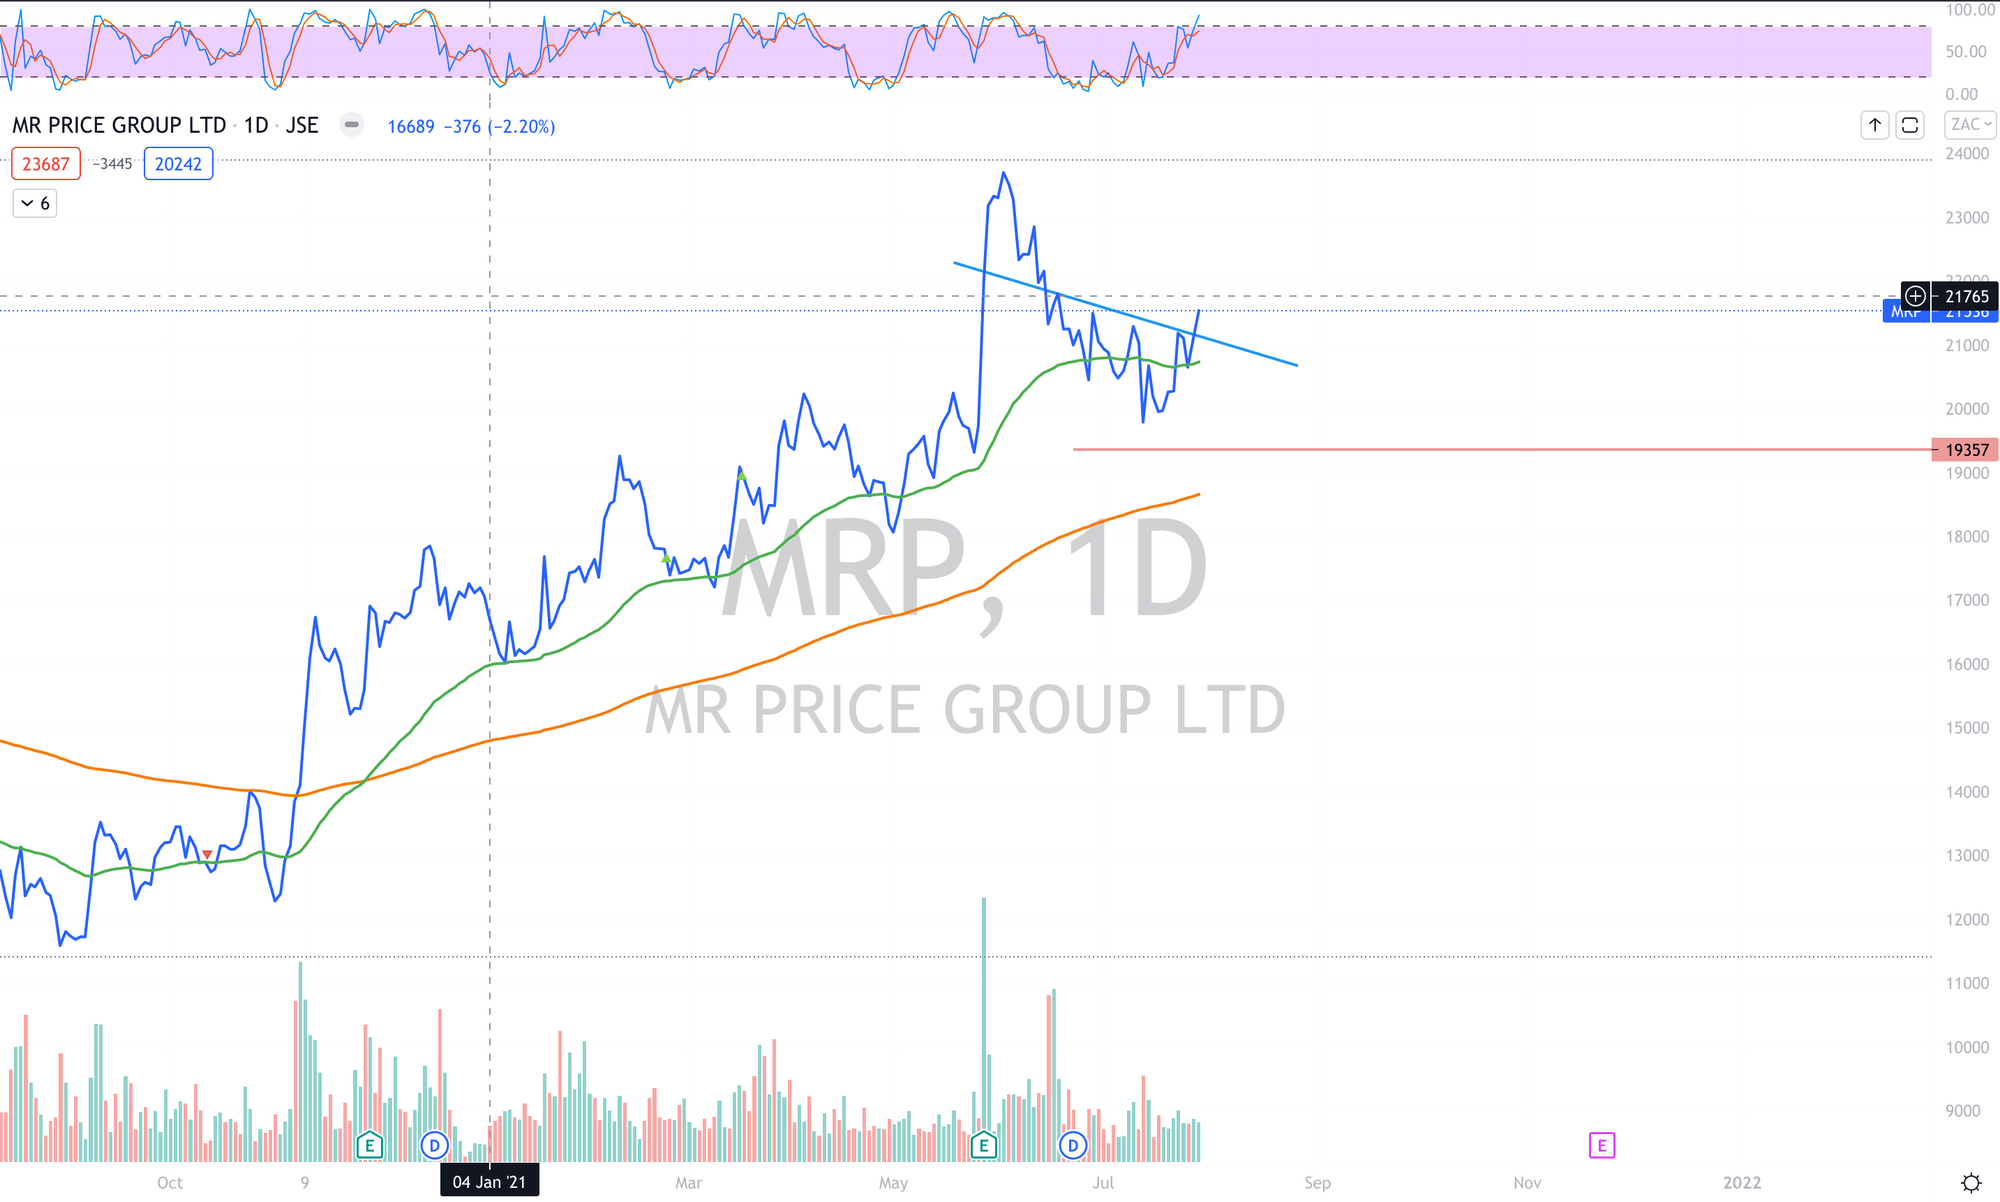
Daily chart.
Looks like Mr Price is on the go again. The stock firmly held the 50 day EMA after the recent market correction. Signals a good buy with a stop loss just below the recent swing low around the R193 level .


Comments ()