Trading Technique - Trending Charts (XAU/USD)
Trader Nick's Trading Technique, post number 1 in the series. Insight from Nick on his approach to trading trending charts.

I look at charts with an idea that the market isn't perfect, but that it has a simple baseline pattern running through almost every stock you encounter.
The base pattern I observe in the markets is that of a wave as seen below.
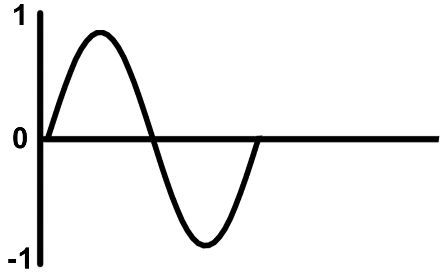
Sometimes the wave forms in uptrends or in a downtrends and sometimes you will find it in charts that are trending sideways.
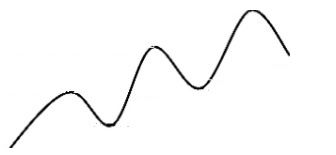
I prefer the chart to show me areas or zones where bulls or bears may generally step in and not very specific points or prices on a chart.
So If I look at Gold in $, I’ll use a regression trend channel first as seen below.
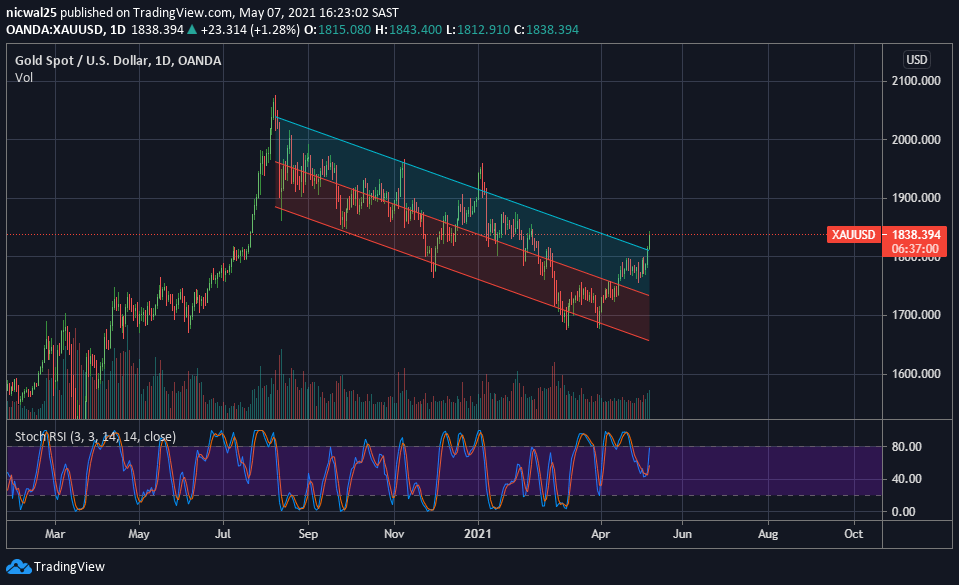
If a price pushes through the “Regression trend line” that would indicate that it is further away from the baseline and should revert either to the upside or to the downside in the near future.
Another step I like to introduce would be to layer a parallel channel on the peak points and bottom dips.
This will be me imposing my own views of trends onto the chart but as you can see it creates “zones”.
These zones become buying or selling areas, they are not exact, but they offer an area where the stock you’re looking at might change direction in the near term.
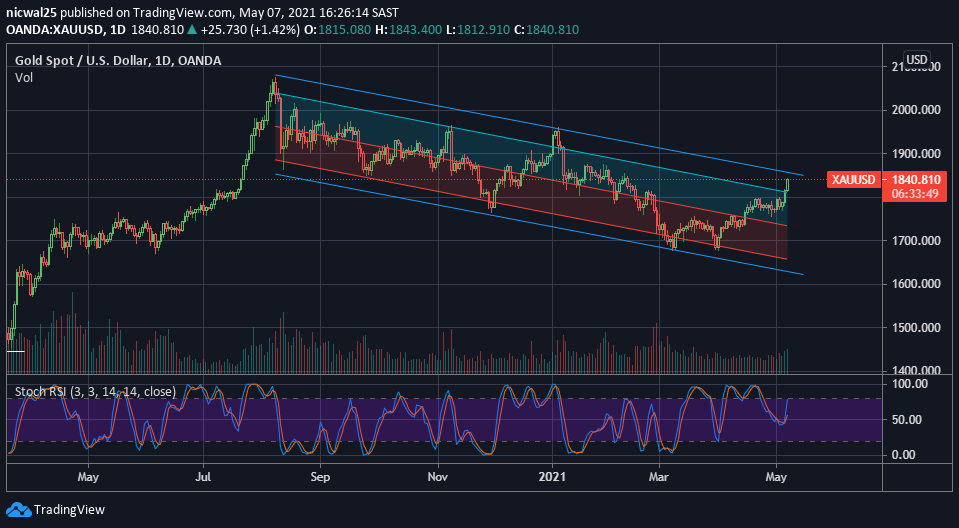
While looking at gold, it has broken out of the regression trend line, but it is within the “zone” between the regression trend line and the parallel trend line.
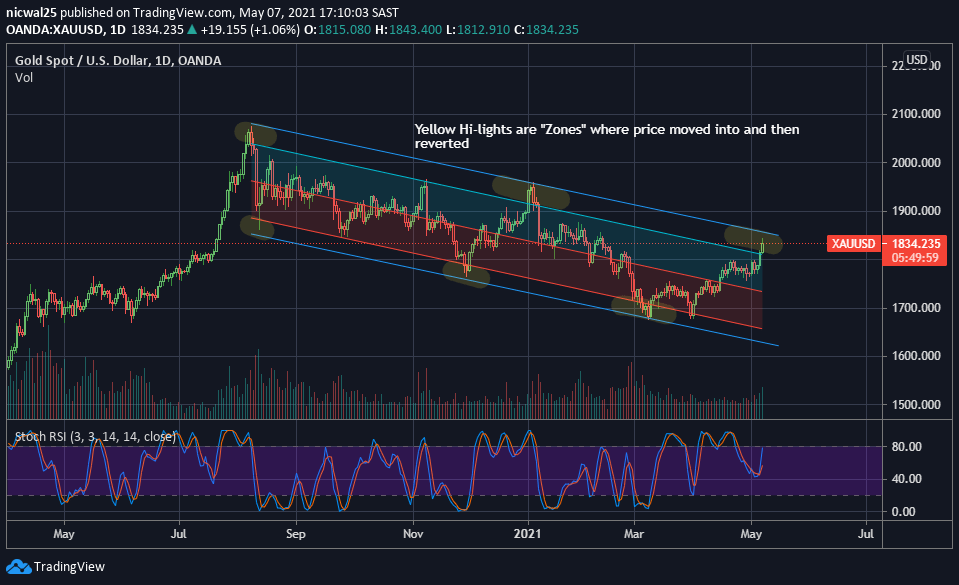
With all this in mind I would look at the current area as a selling zone, but this is where things get a bit tricky.
We have a double bottom in gold which is bullish. While it has also created small steps up in the chart, minor pull backs and then moves to the up side, creating the wave uptrend pattern we looked at in the beginning.
I would be watching this one carefully. If we get a breakout of parallel line and a small bull flag or a bounce off the trend, then I would consider that a strong trend change and go long gold for at least the next few weeks.


Comments ()