Trading Technique - Uptrends (MTN)
TraderNick looks at his approach to trading uptrends using MTN as an example.

In this 3rdand final look into my trading technique, we’re going to take a look at MTN.
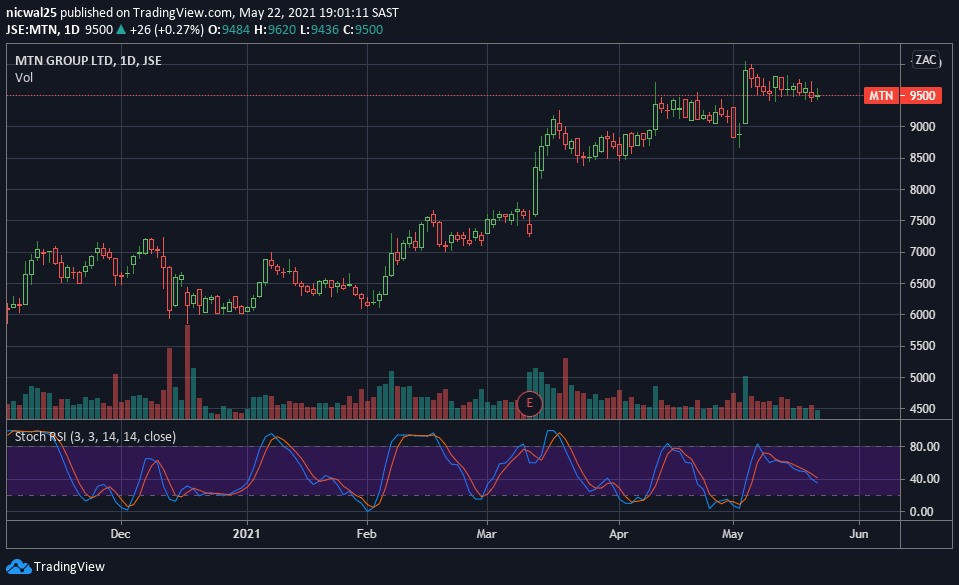
Below we have our chart of MTN, as you can see it has been in a nice upward trend for a few months.
We’re looking for it to continue in this fashion and to get ourselves a good entry for the next leg up.
I’ve gone ahead and added the regression trend line. I’m doing so from where the uptrend starts.
I won’t be adding the zonal trends lines that we used in the previous charts, as there has only been one instance where it peaked out of the regression lines and that was to the upside, not enough data to create a zonal trend.
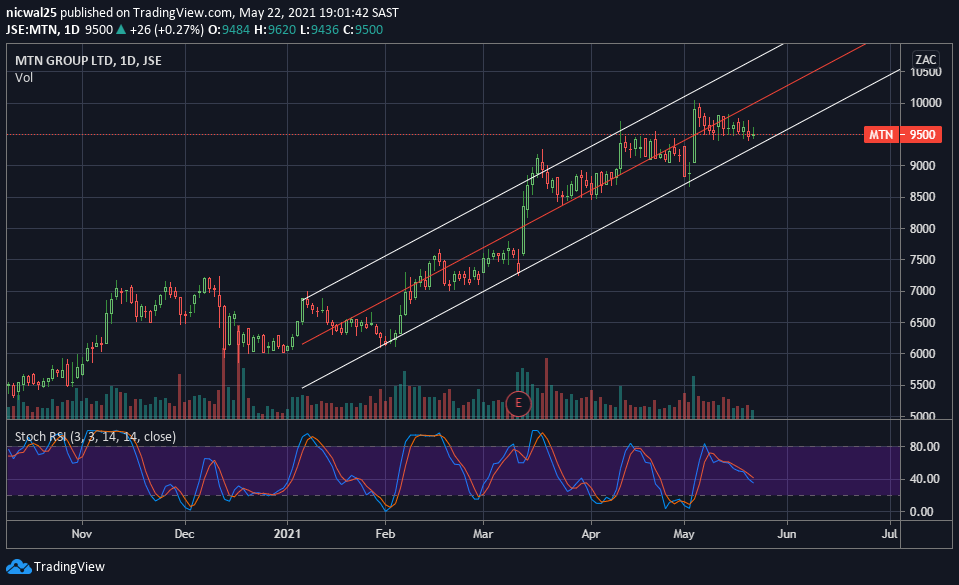
What I’m looking for is the pull backs that coincide with a low RSI as seen below.
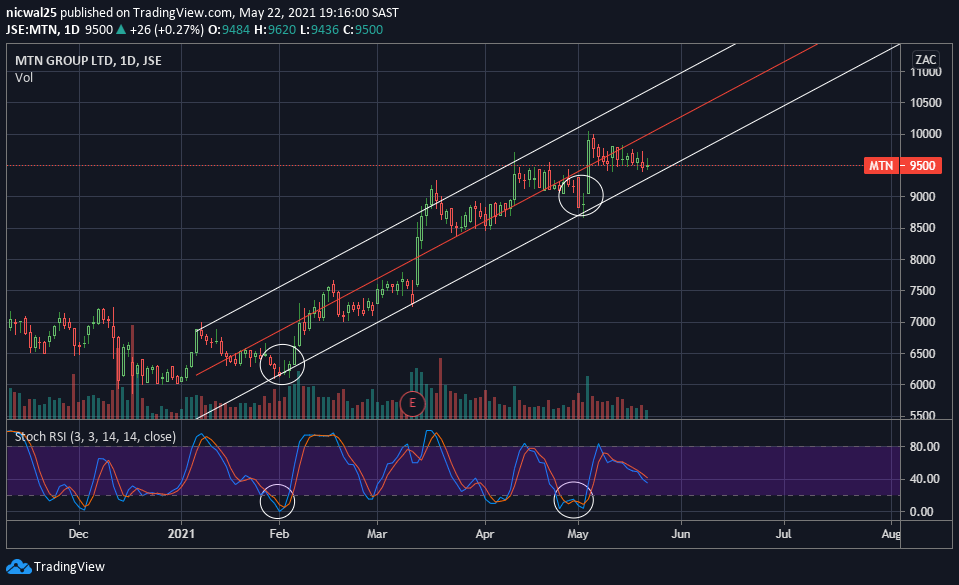
Now that we have highlighted the two previous instances, we are going to look for a similar setup that we can enter on.
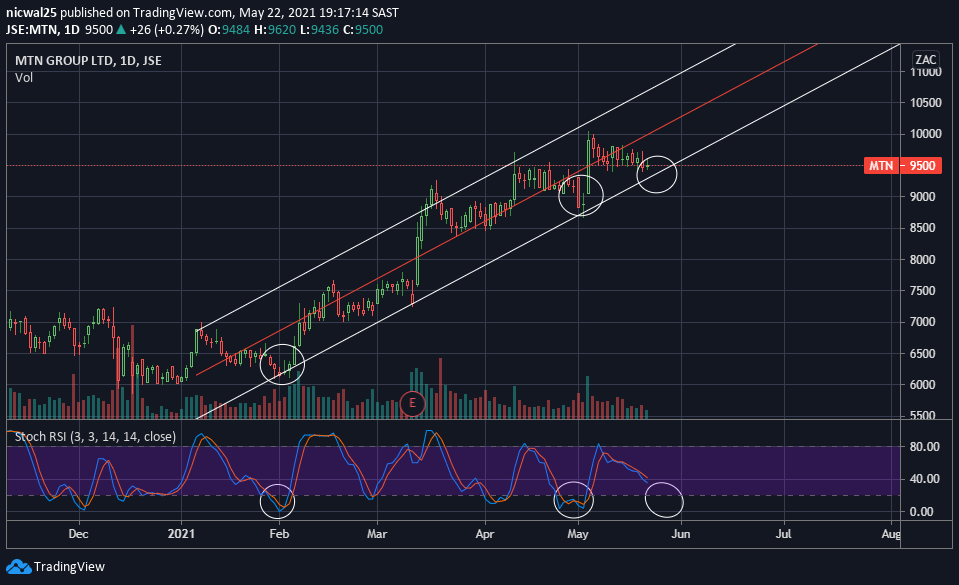
Right now the RSI hasn’t pulled back enough to indicate that it is oversold.
But what you can start to pick up on with regards to the bar chart are the actual bars, there seems to be buyers/support at the R95.00 area.
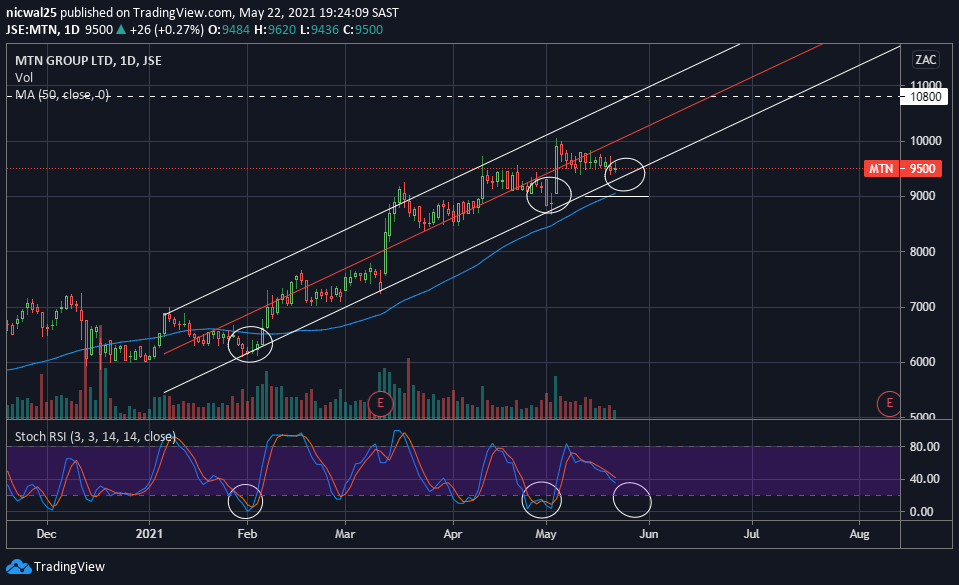
If I was to enter a trade on this setup, I would be looking for an entry around R94.00 – R94.50 for a long.
The SL will be a daily close below the 50EMA and a TP at the R108.00 – R109.00 area, giving us a good risk to reward trade.
Quick Look at the Setup
- Stock is in an uptrend
- Stock pulls back to the bottom of the channel
- Oversold RSI
- Buyer/Support zone
- 50 EMA Support/Stop
The trade setups I like are very basic.
Overcomplicating things will lead to confusion, so try to keep it simple.
If you've followed through the series, I hope you have found some of it interesting and that you've enjoyed it.


Comments ()