Taking Stock: 16 November 2020
Looking at a SP500, a couple of stocks, USDZAR, Gold and Bitcoin

GSPC (SP500)
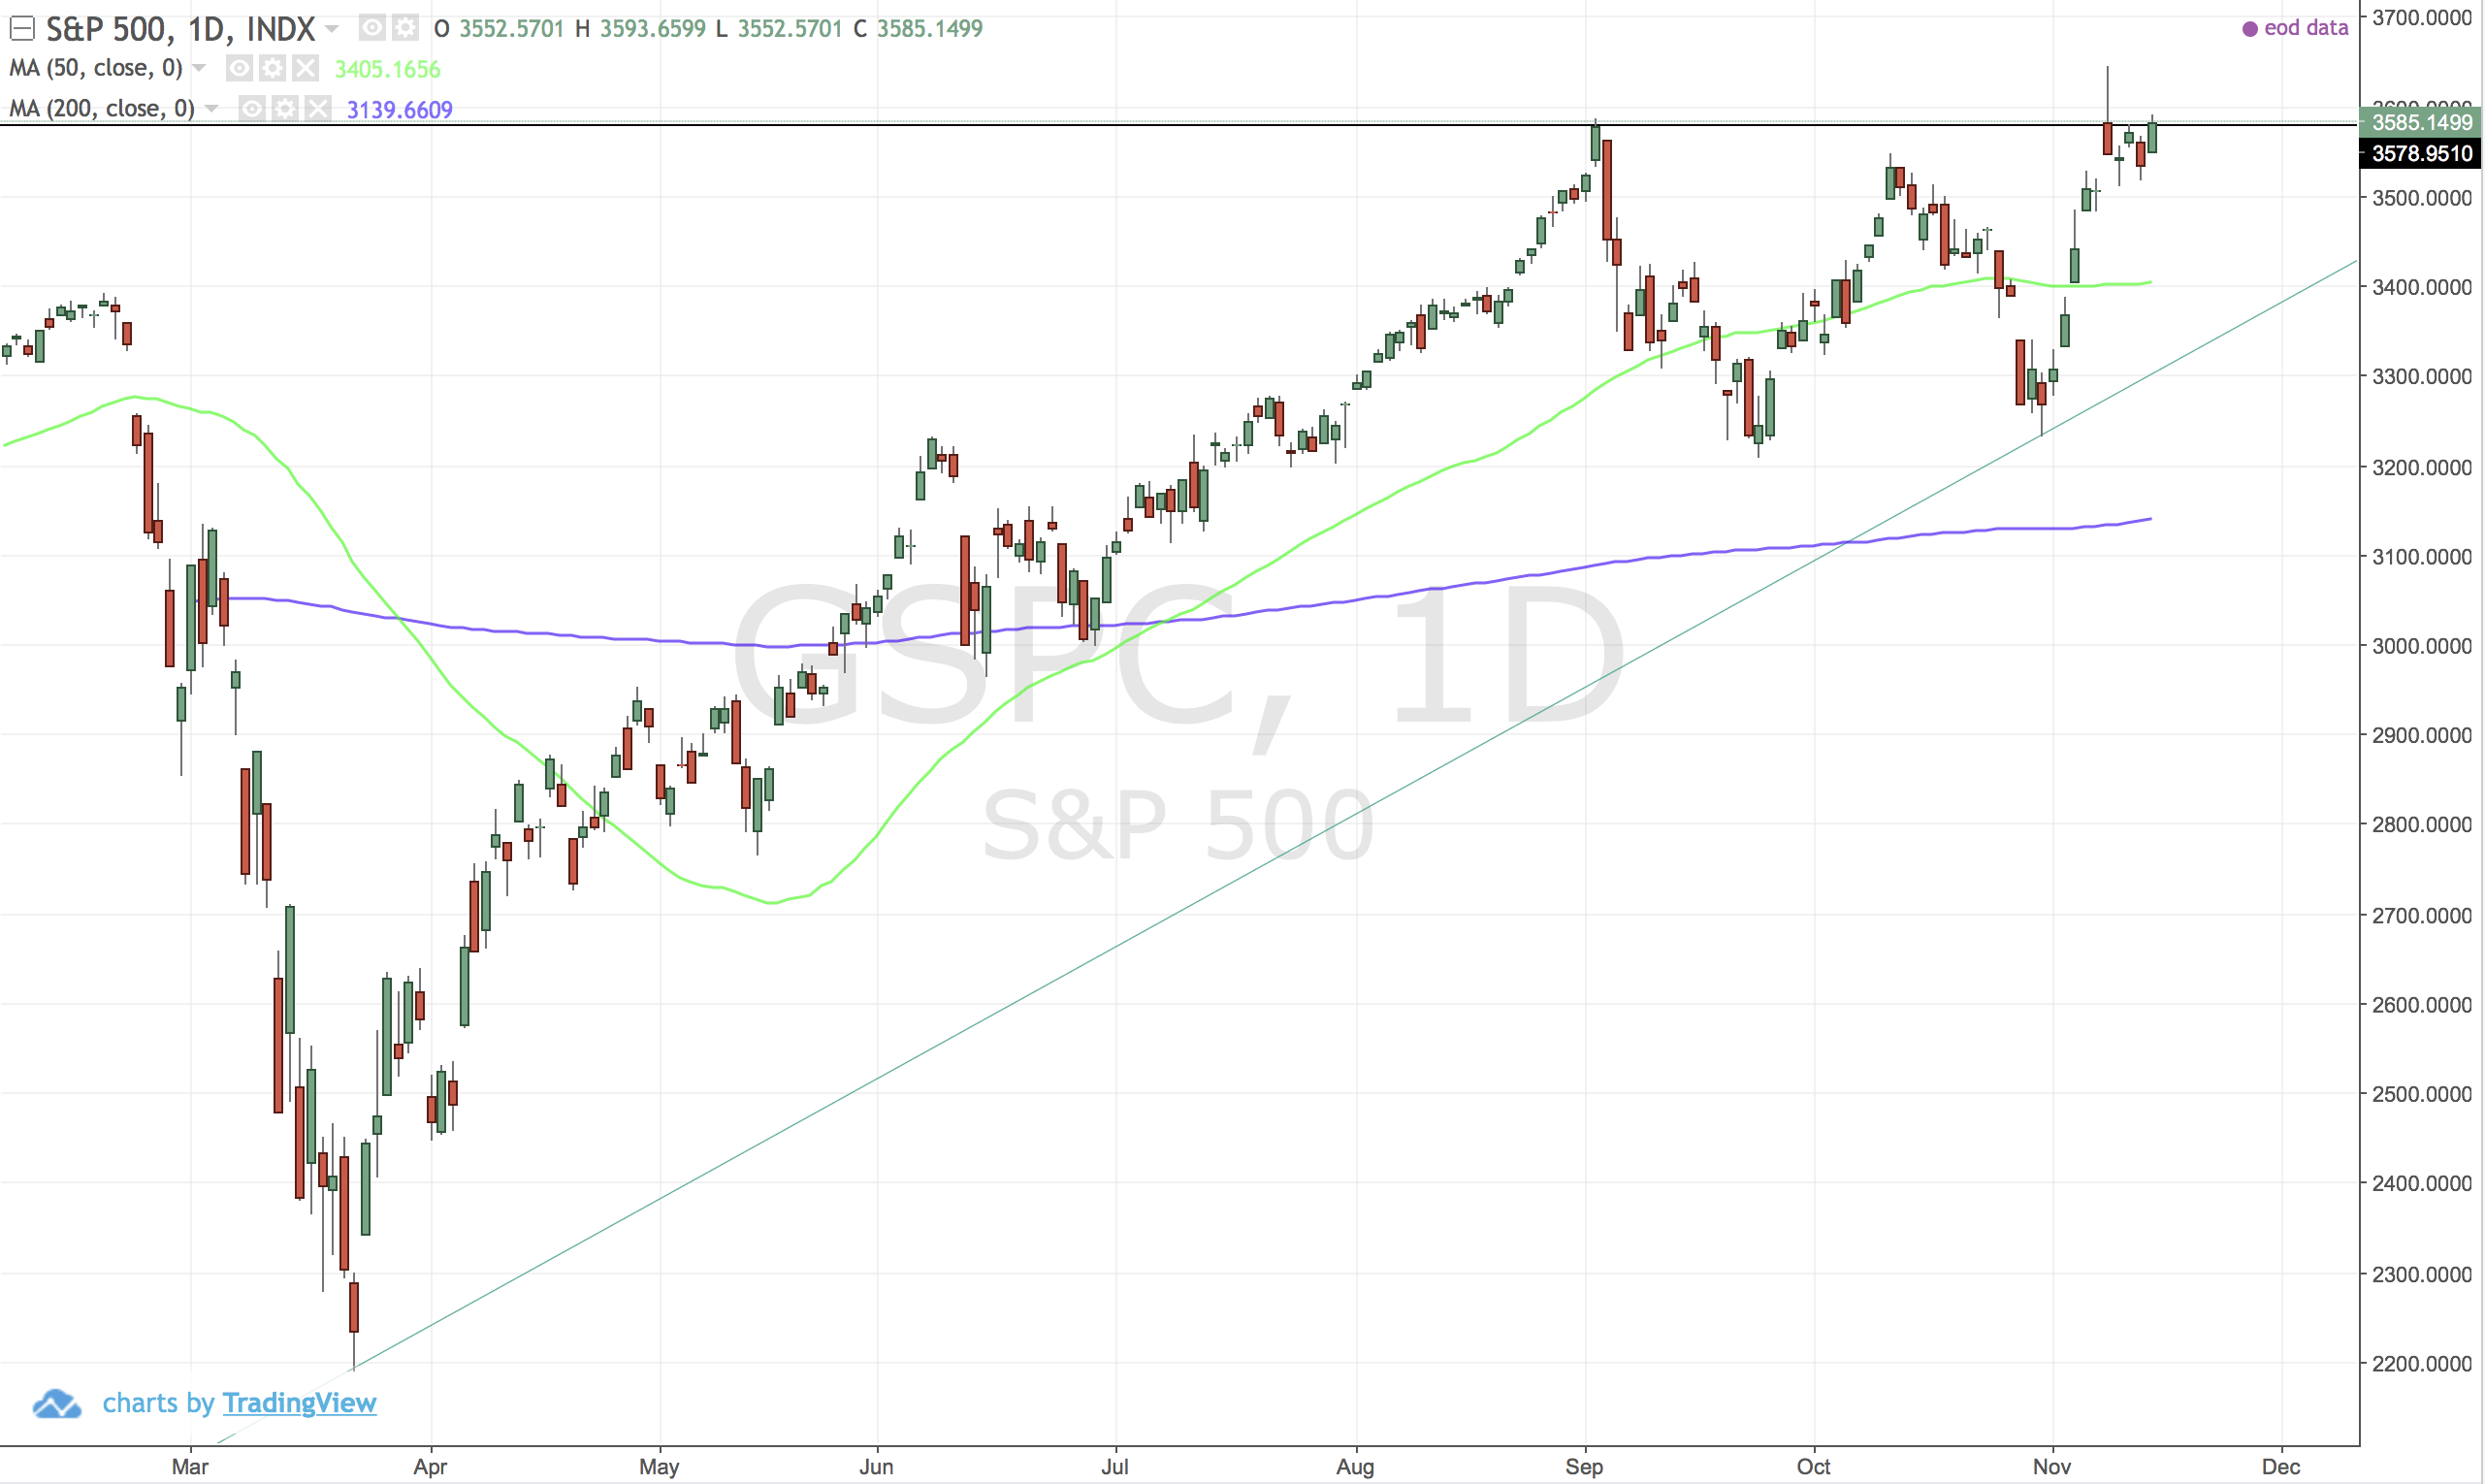
Ascending triangle breakout. More upside coming - well that's the idea.
US:VDC (Vanguard Consumer Staples ETF)
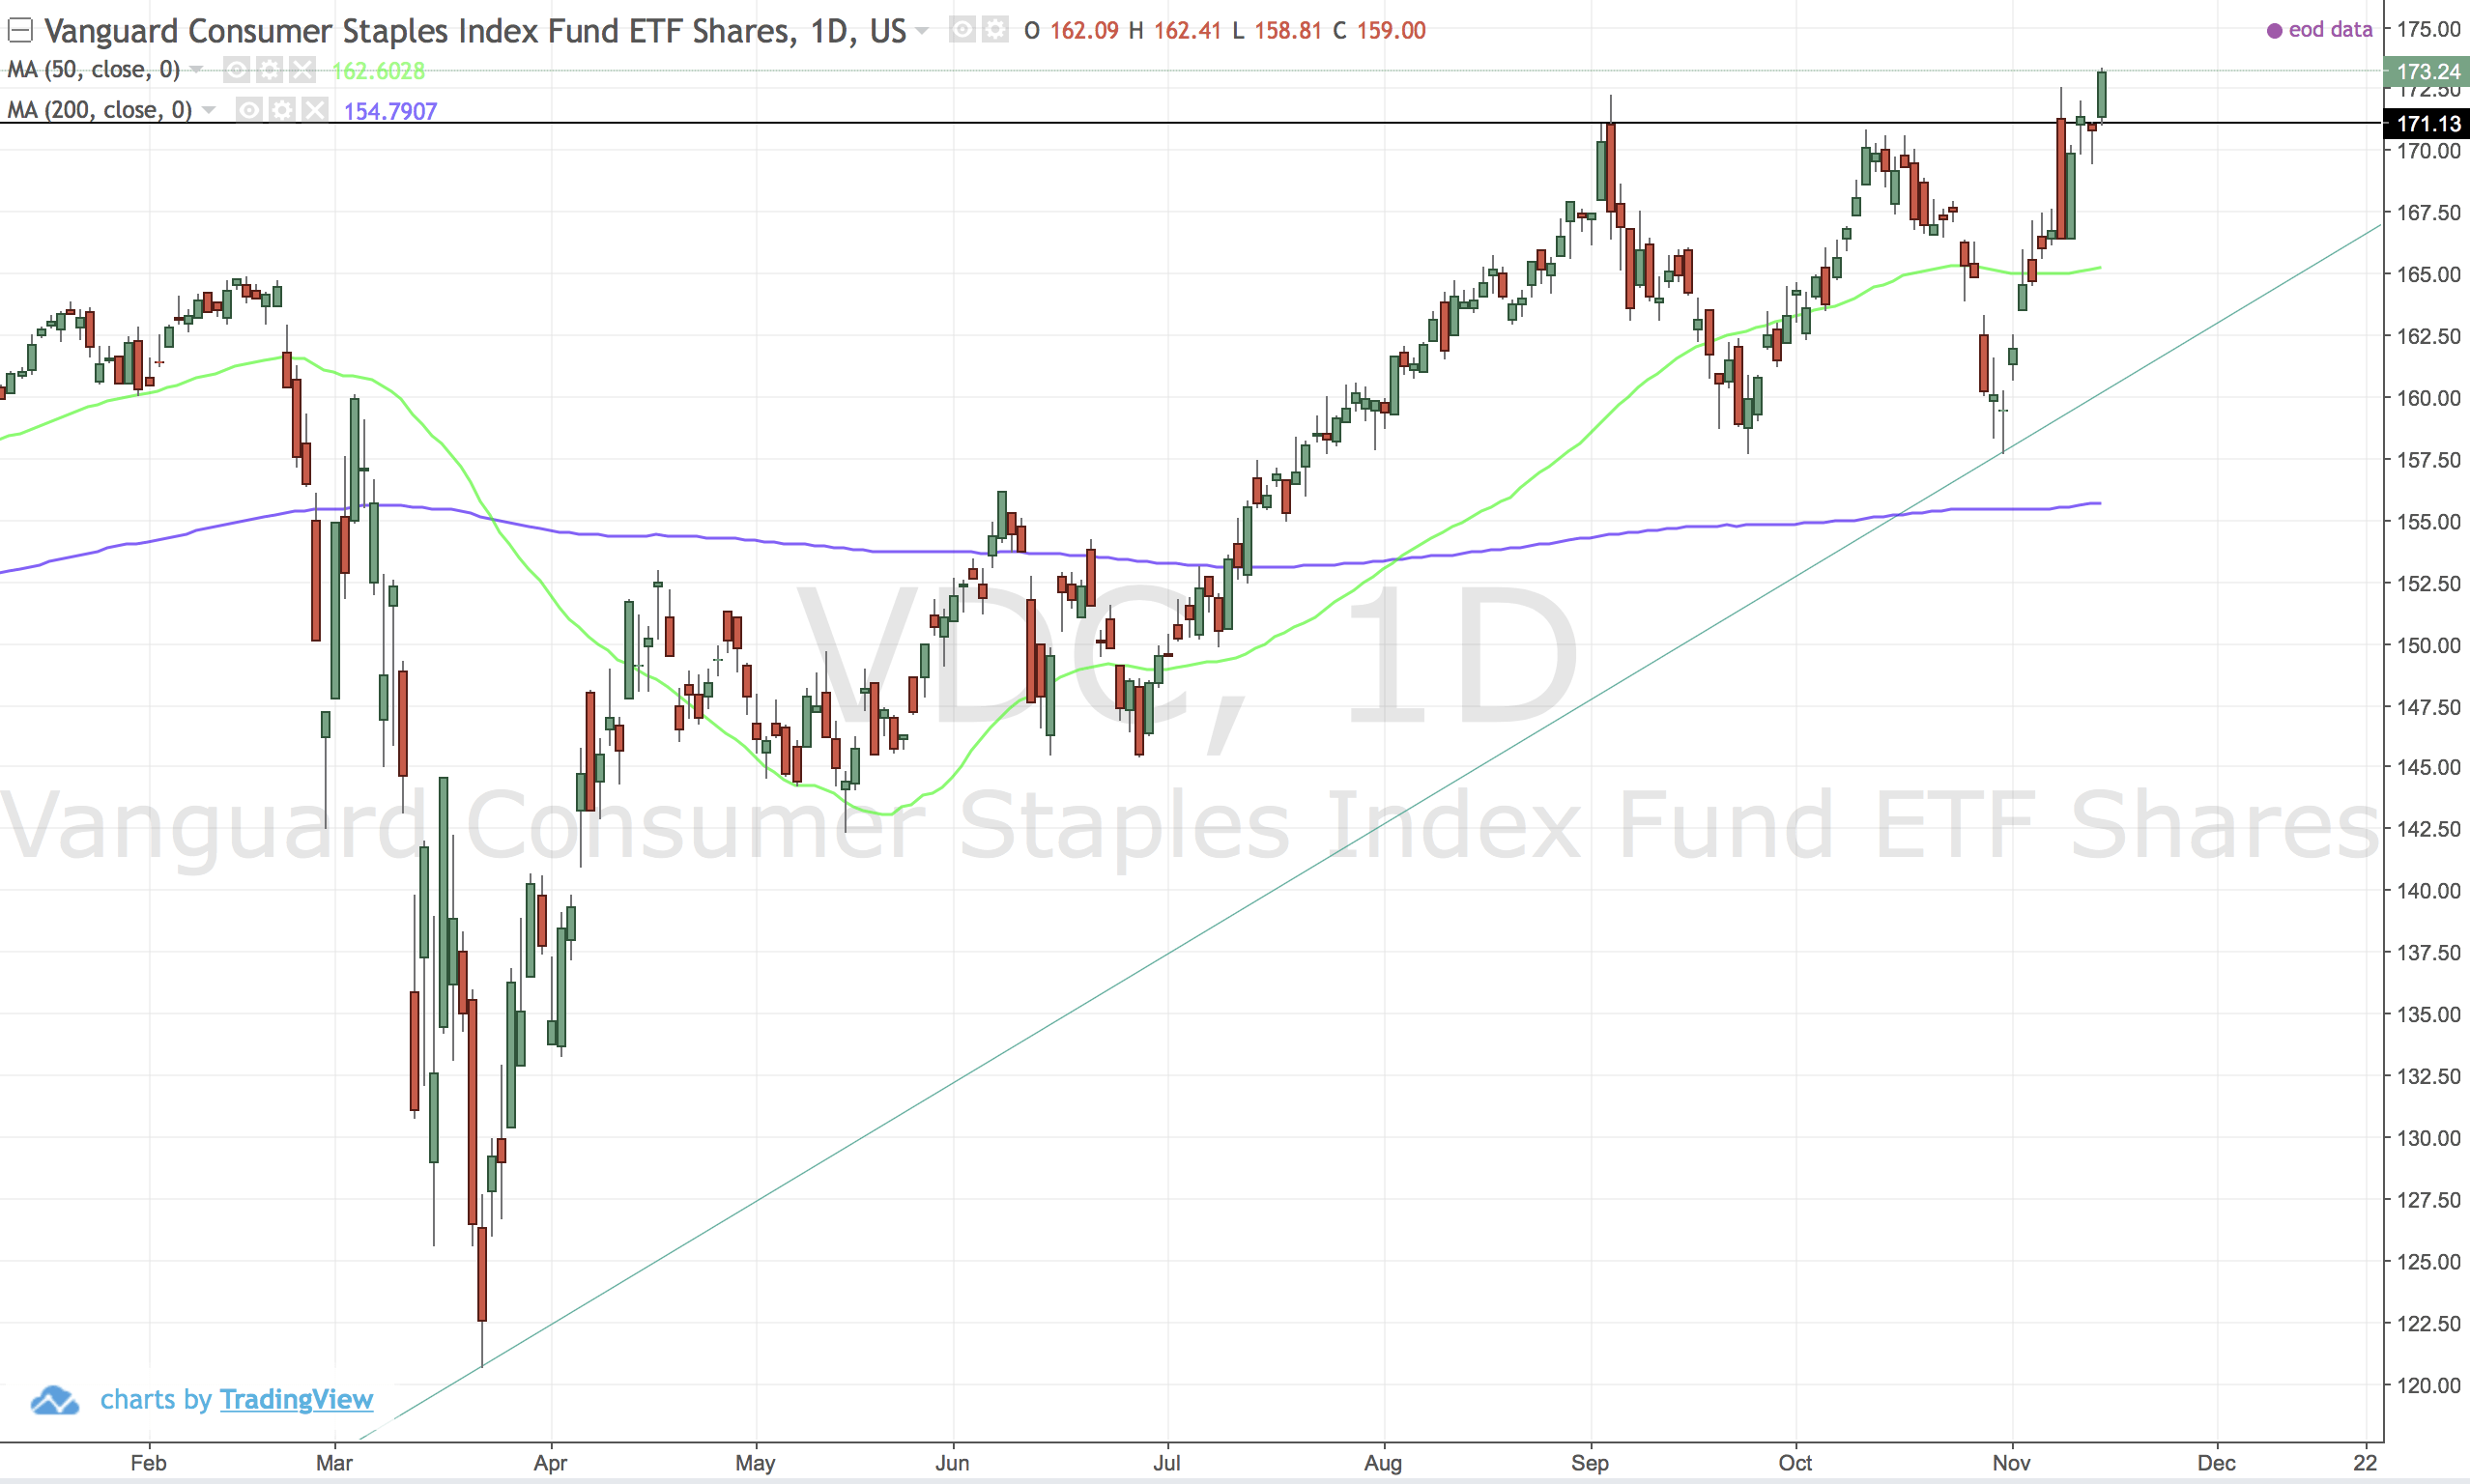
Ascending triangle breakout.
QLT (Quilter)
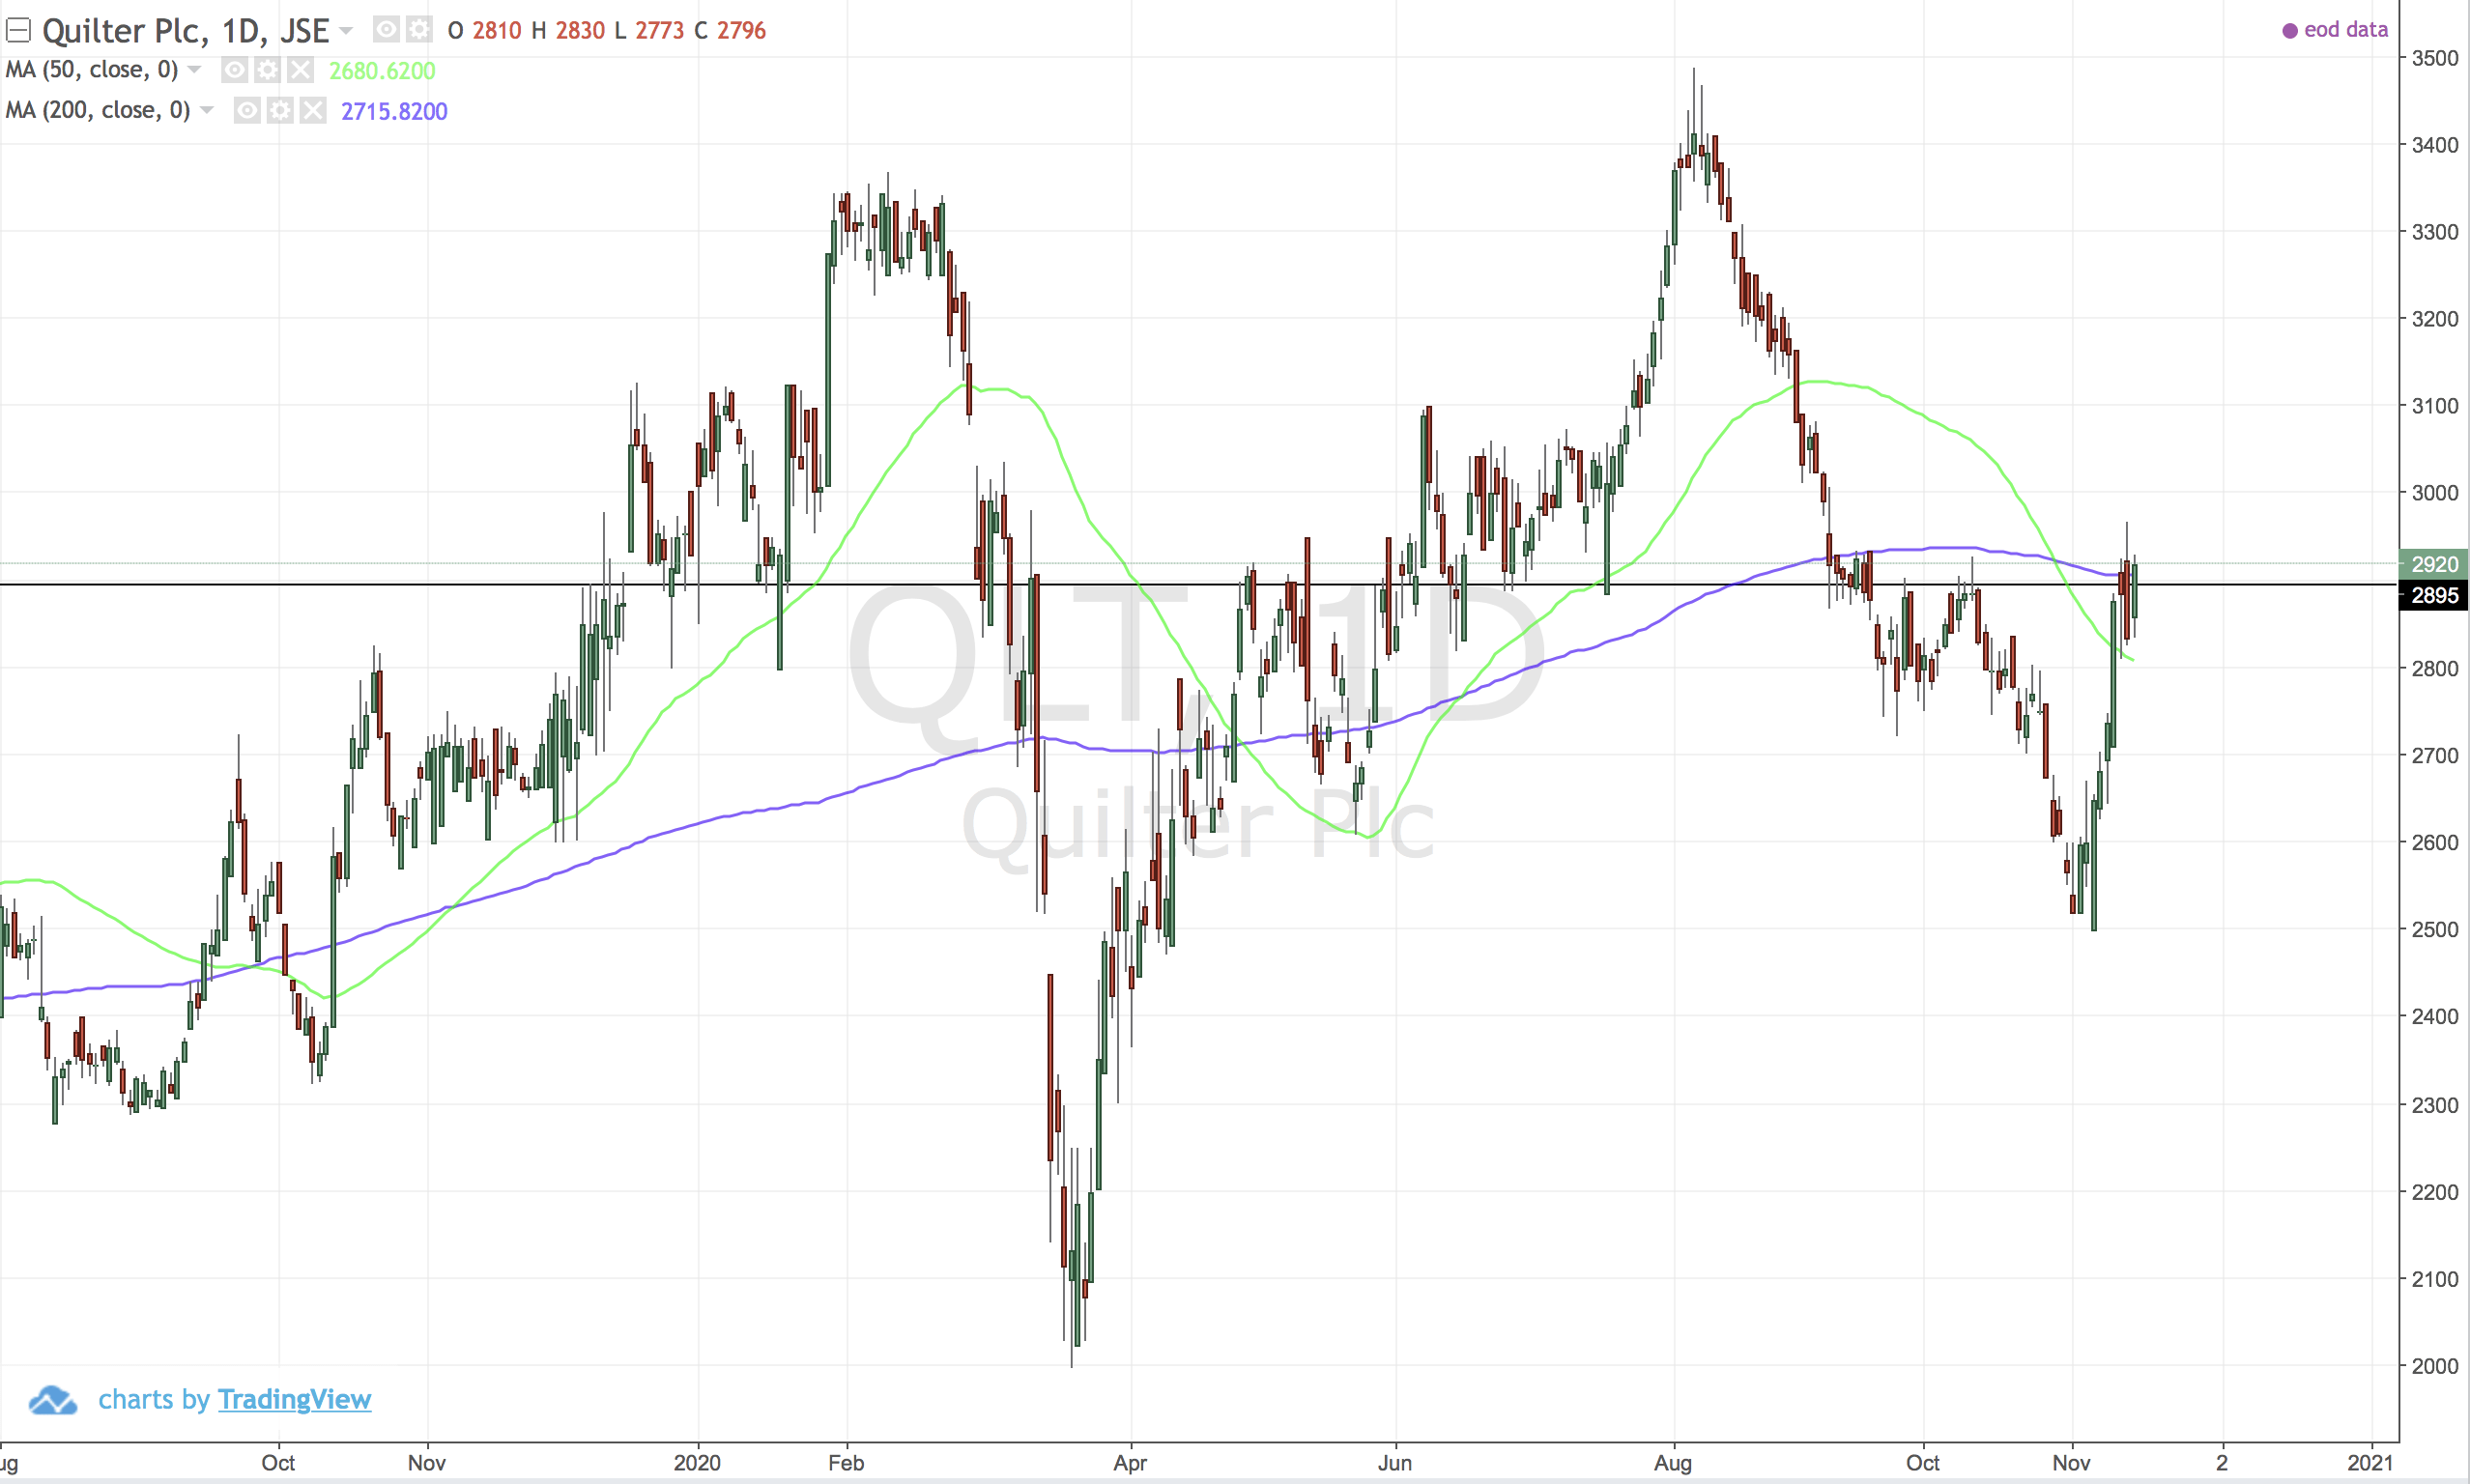
Long term trend is up, it looks a bumpy ride though.
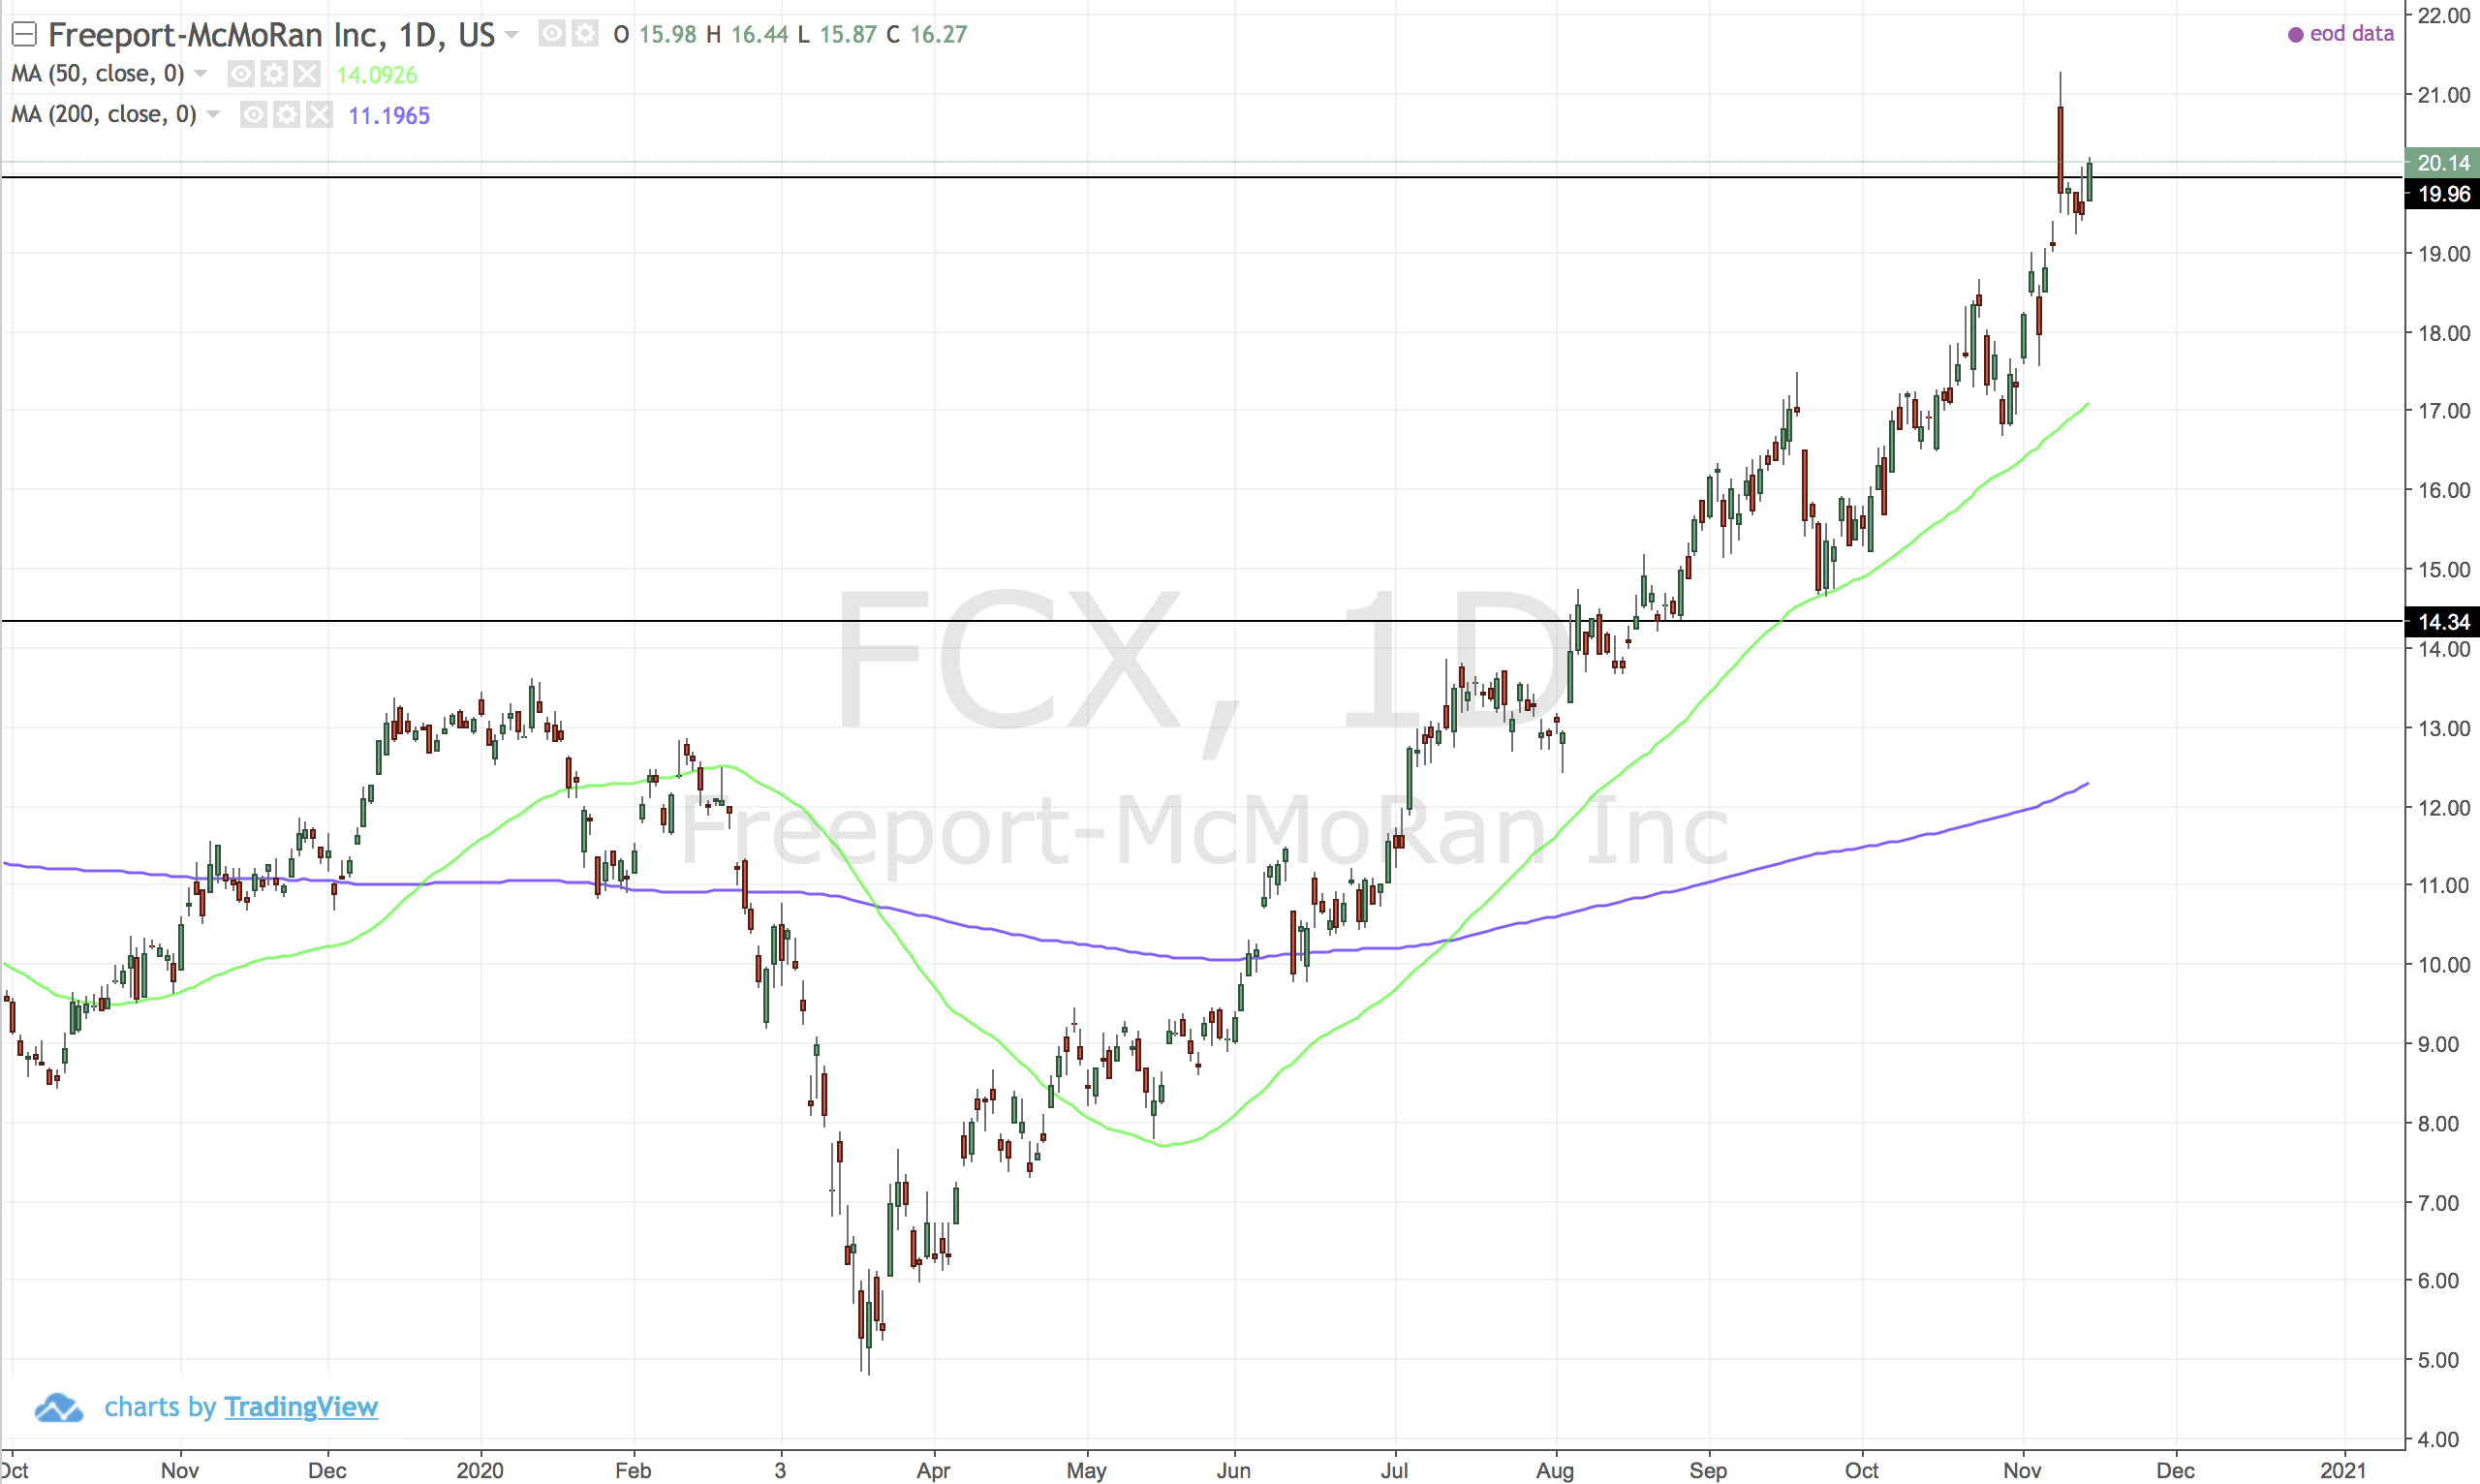
US:FCX (Freeport-Moran)
BTCUSD (Bitcoin in Dollars)
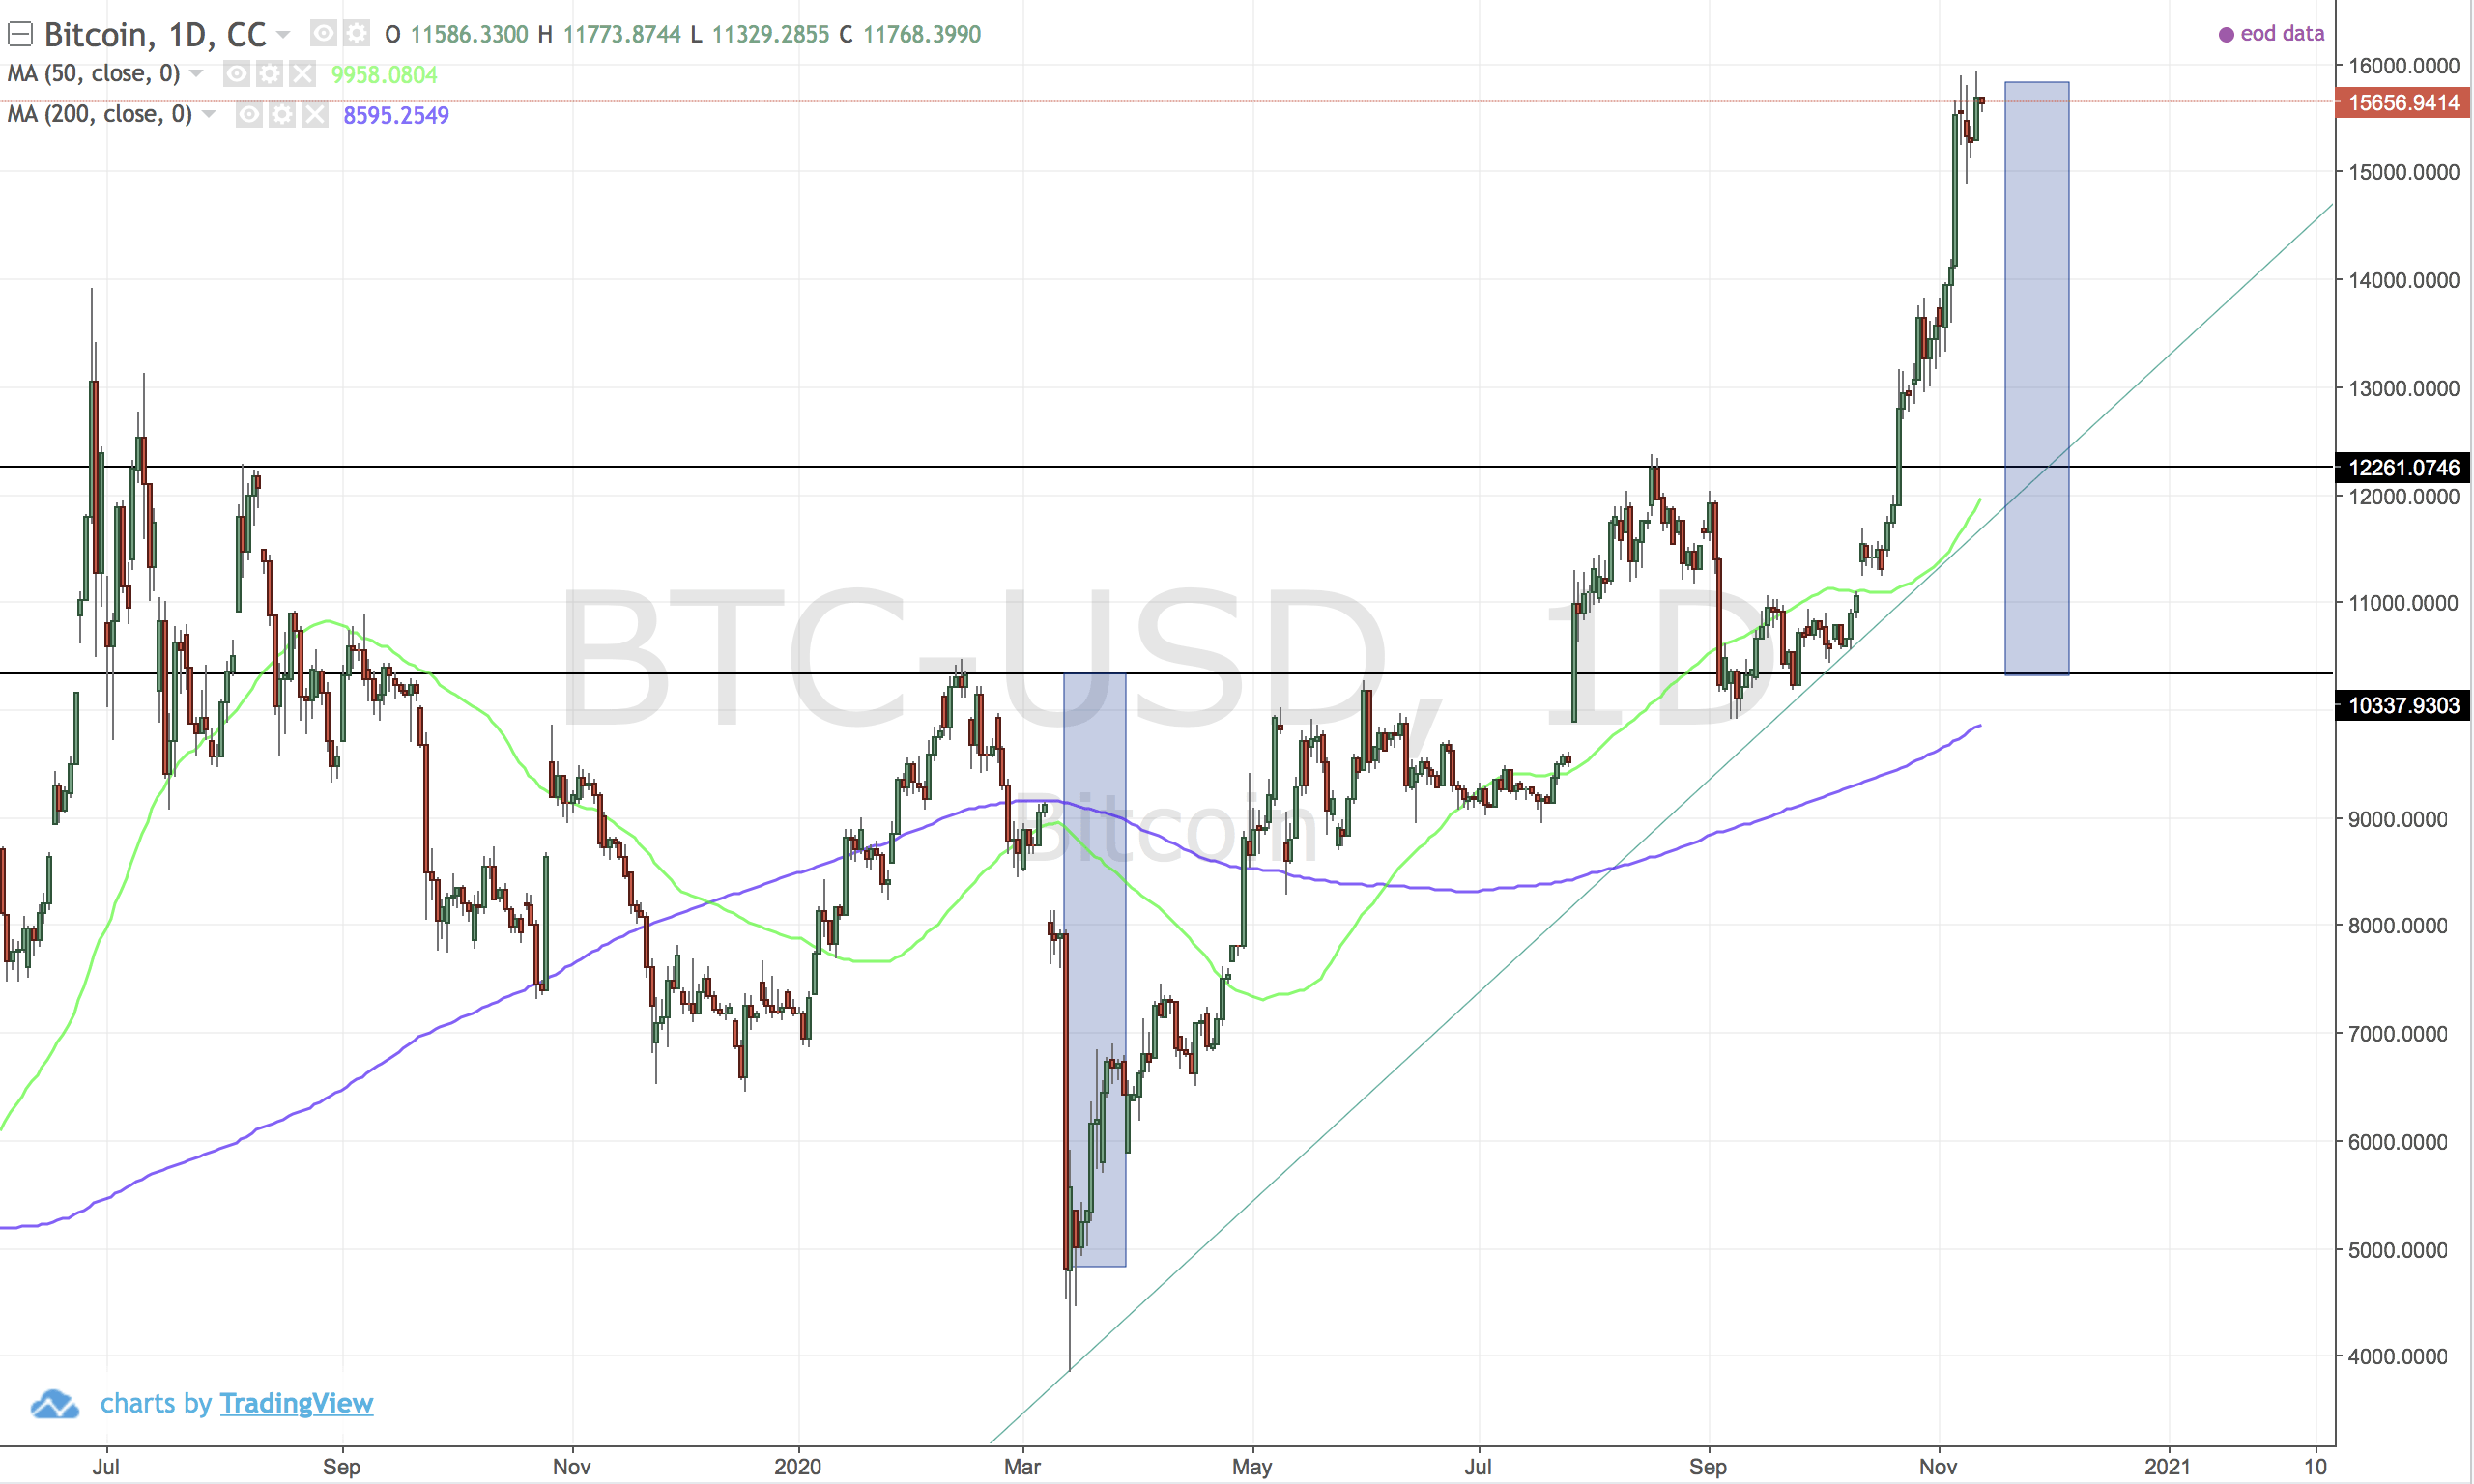
Reached the projection of the inverse head and shoulders pattern. I am looking for a mean reversion to the trendline to enter.
GC (Gold)
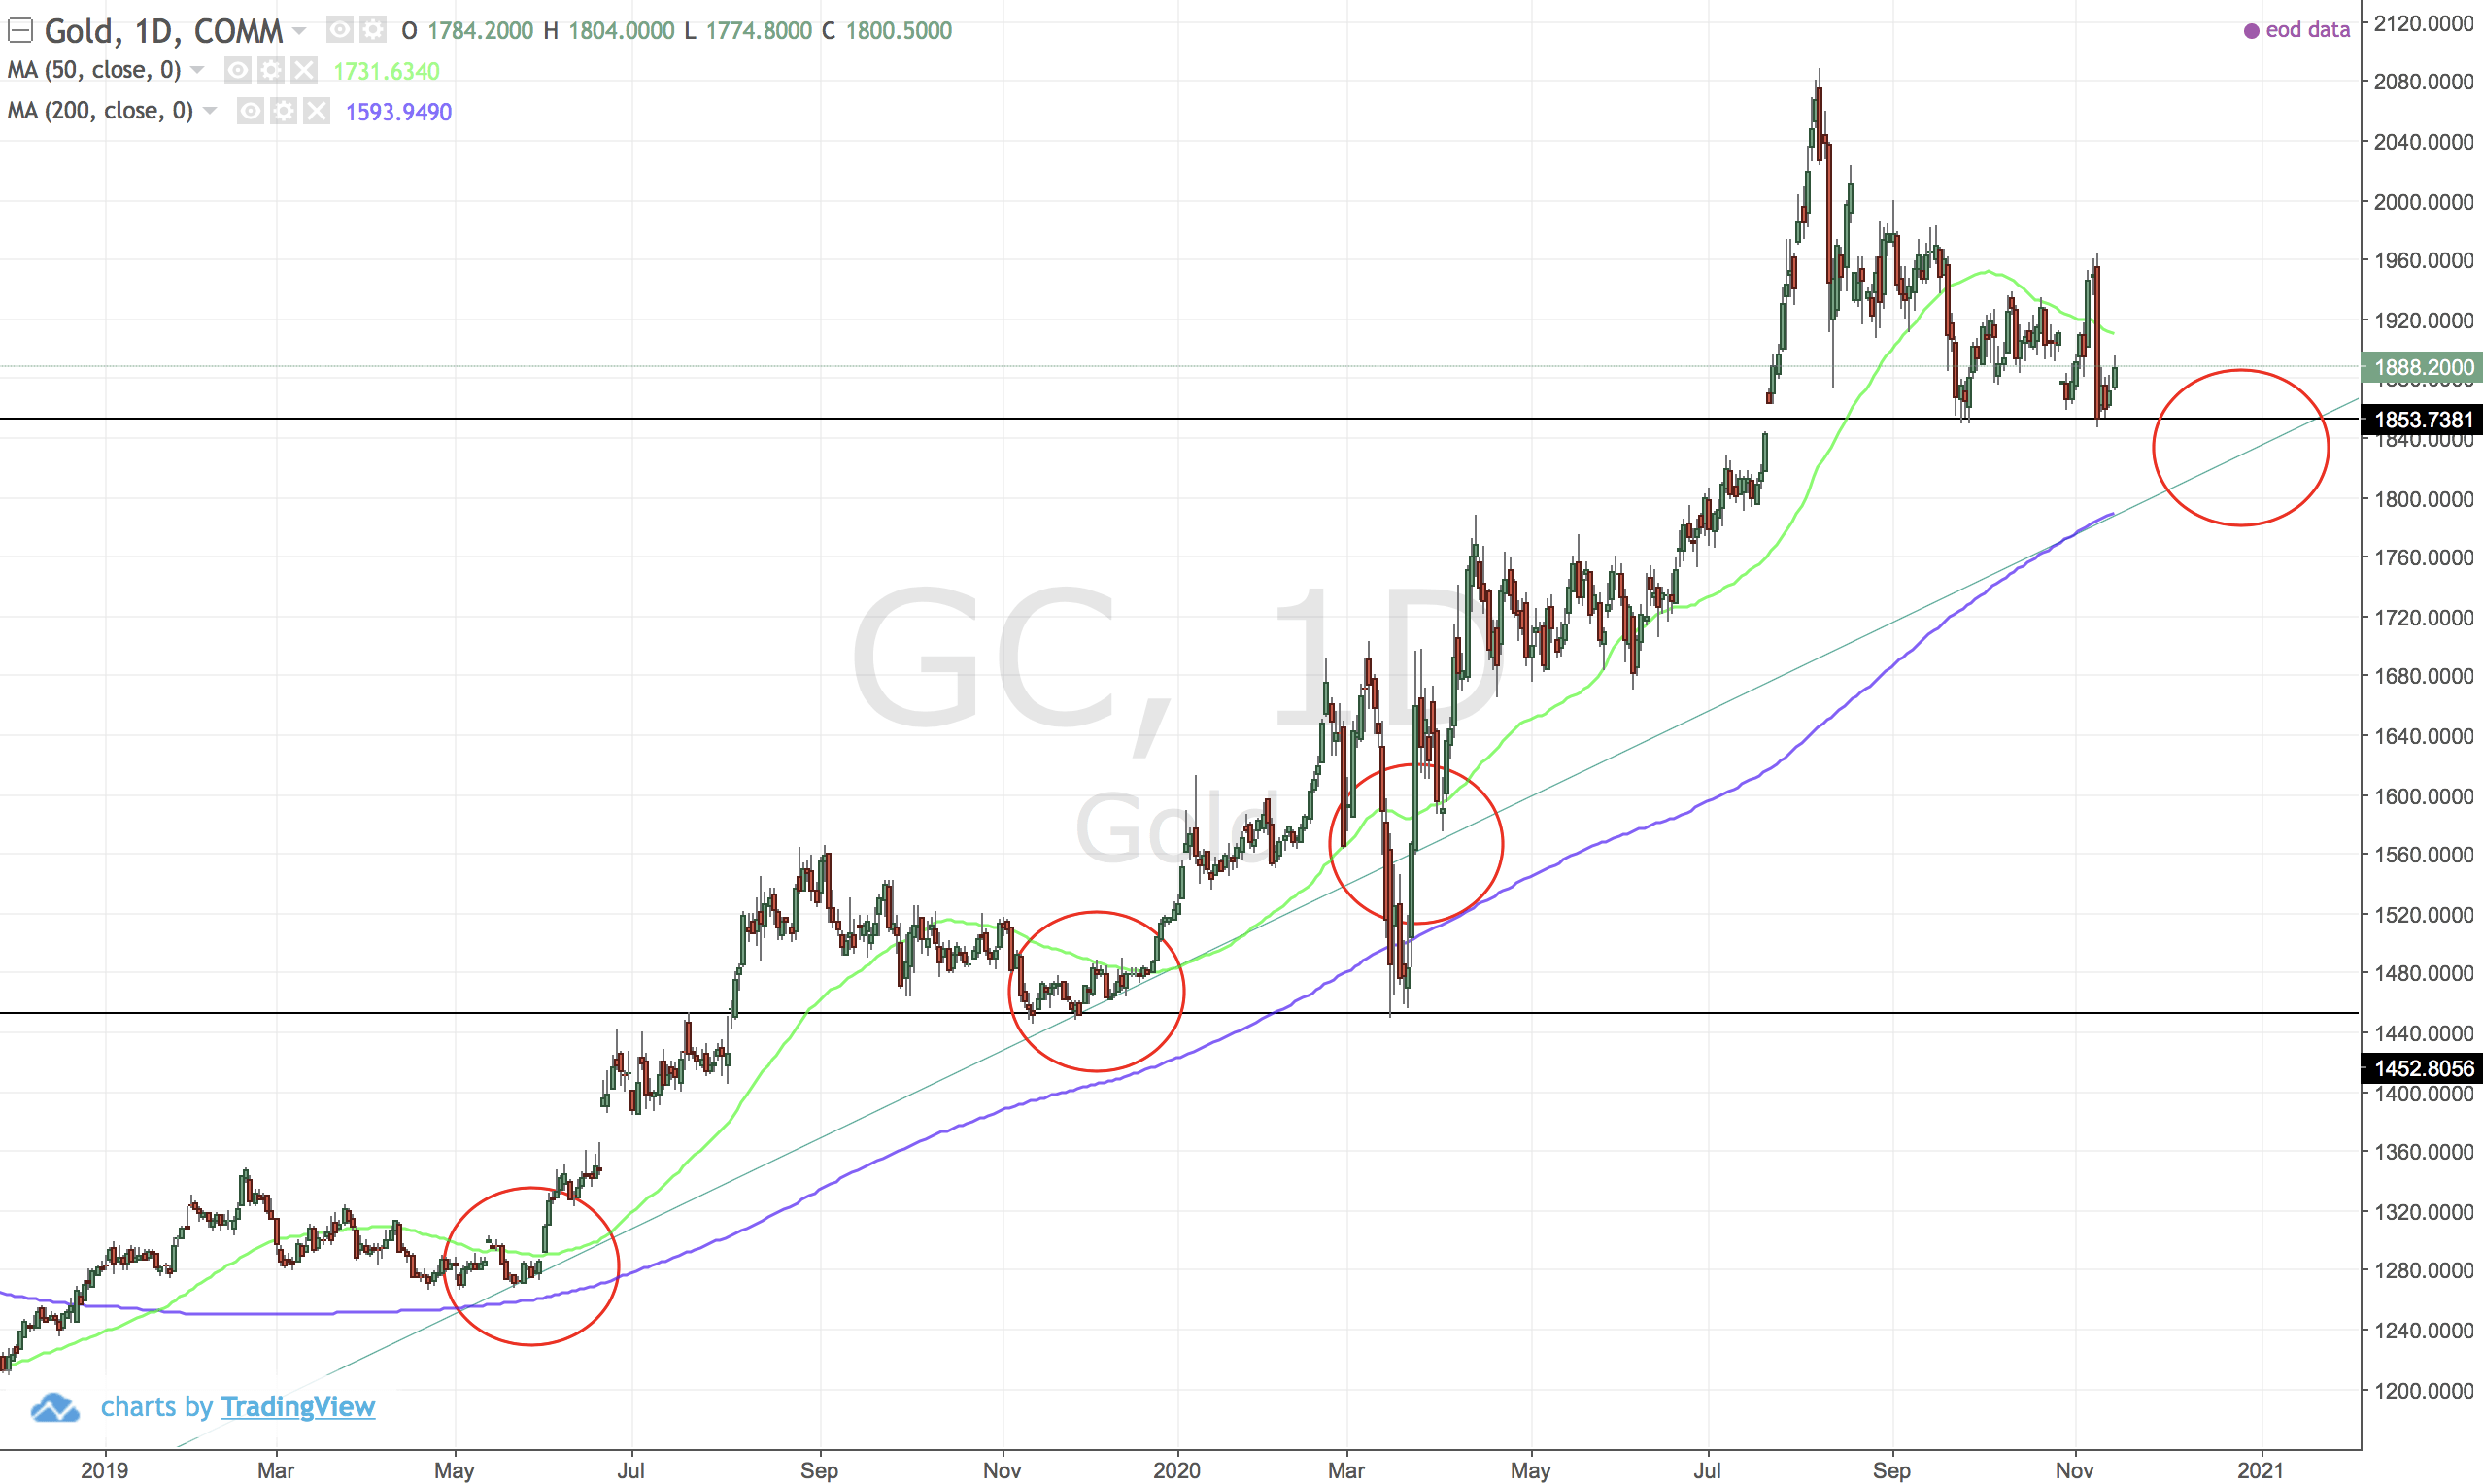
Long term up trend. Is it time to reload on gold?
USDZAR
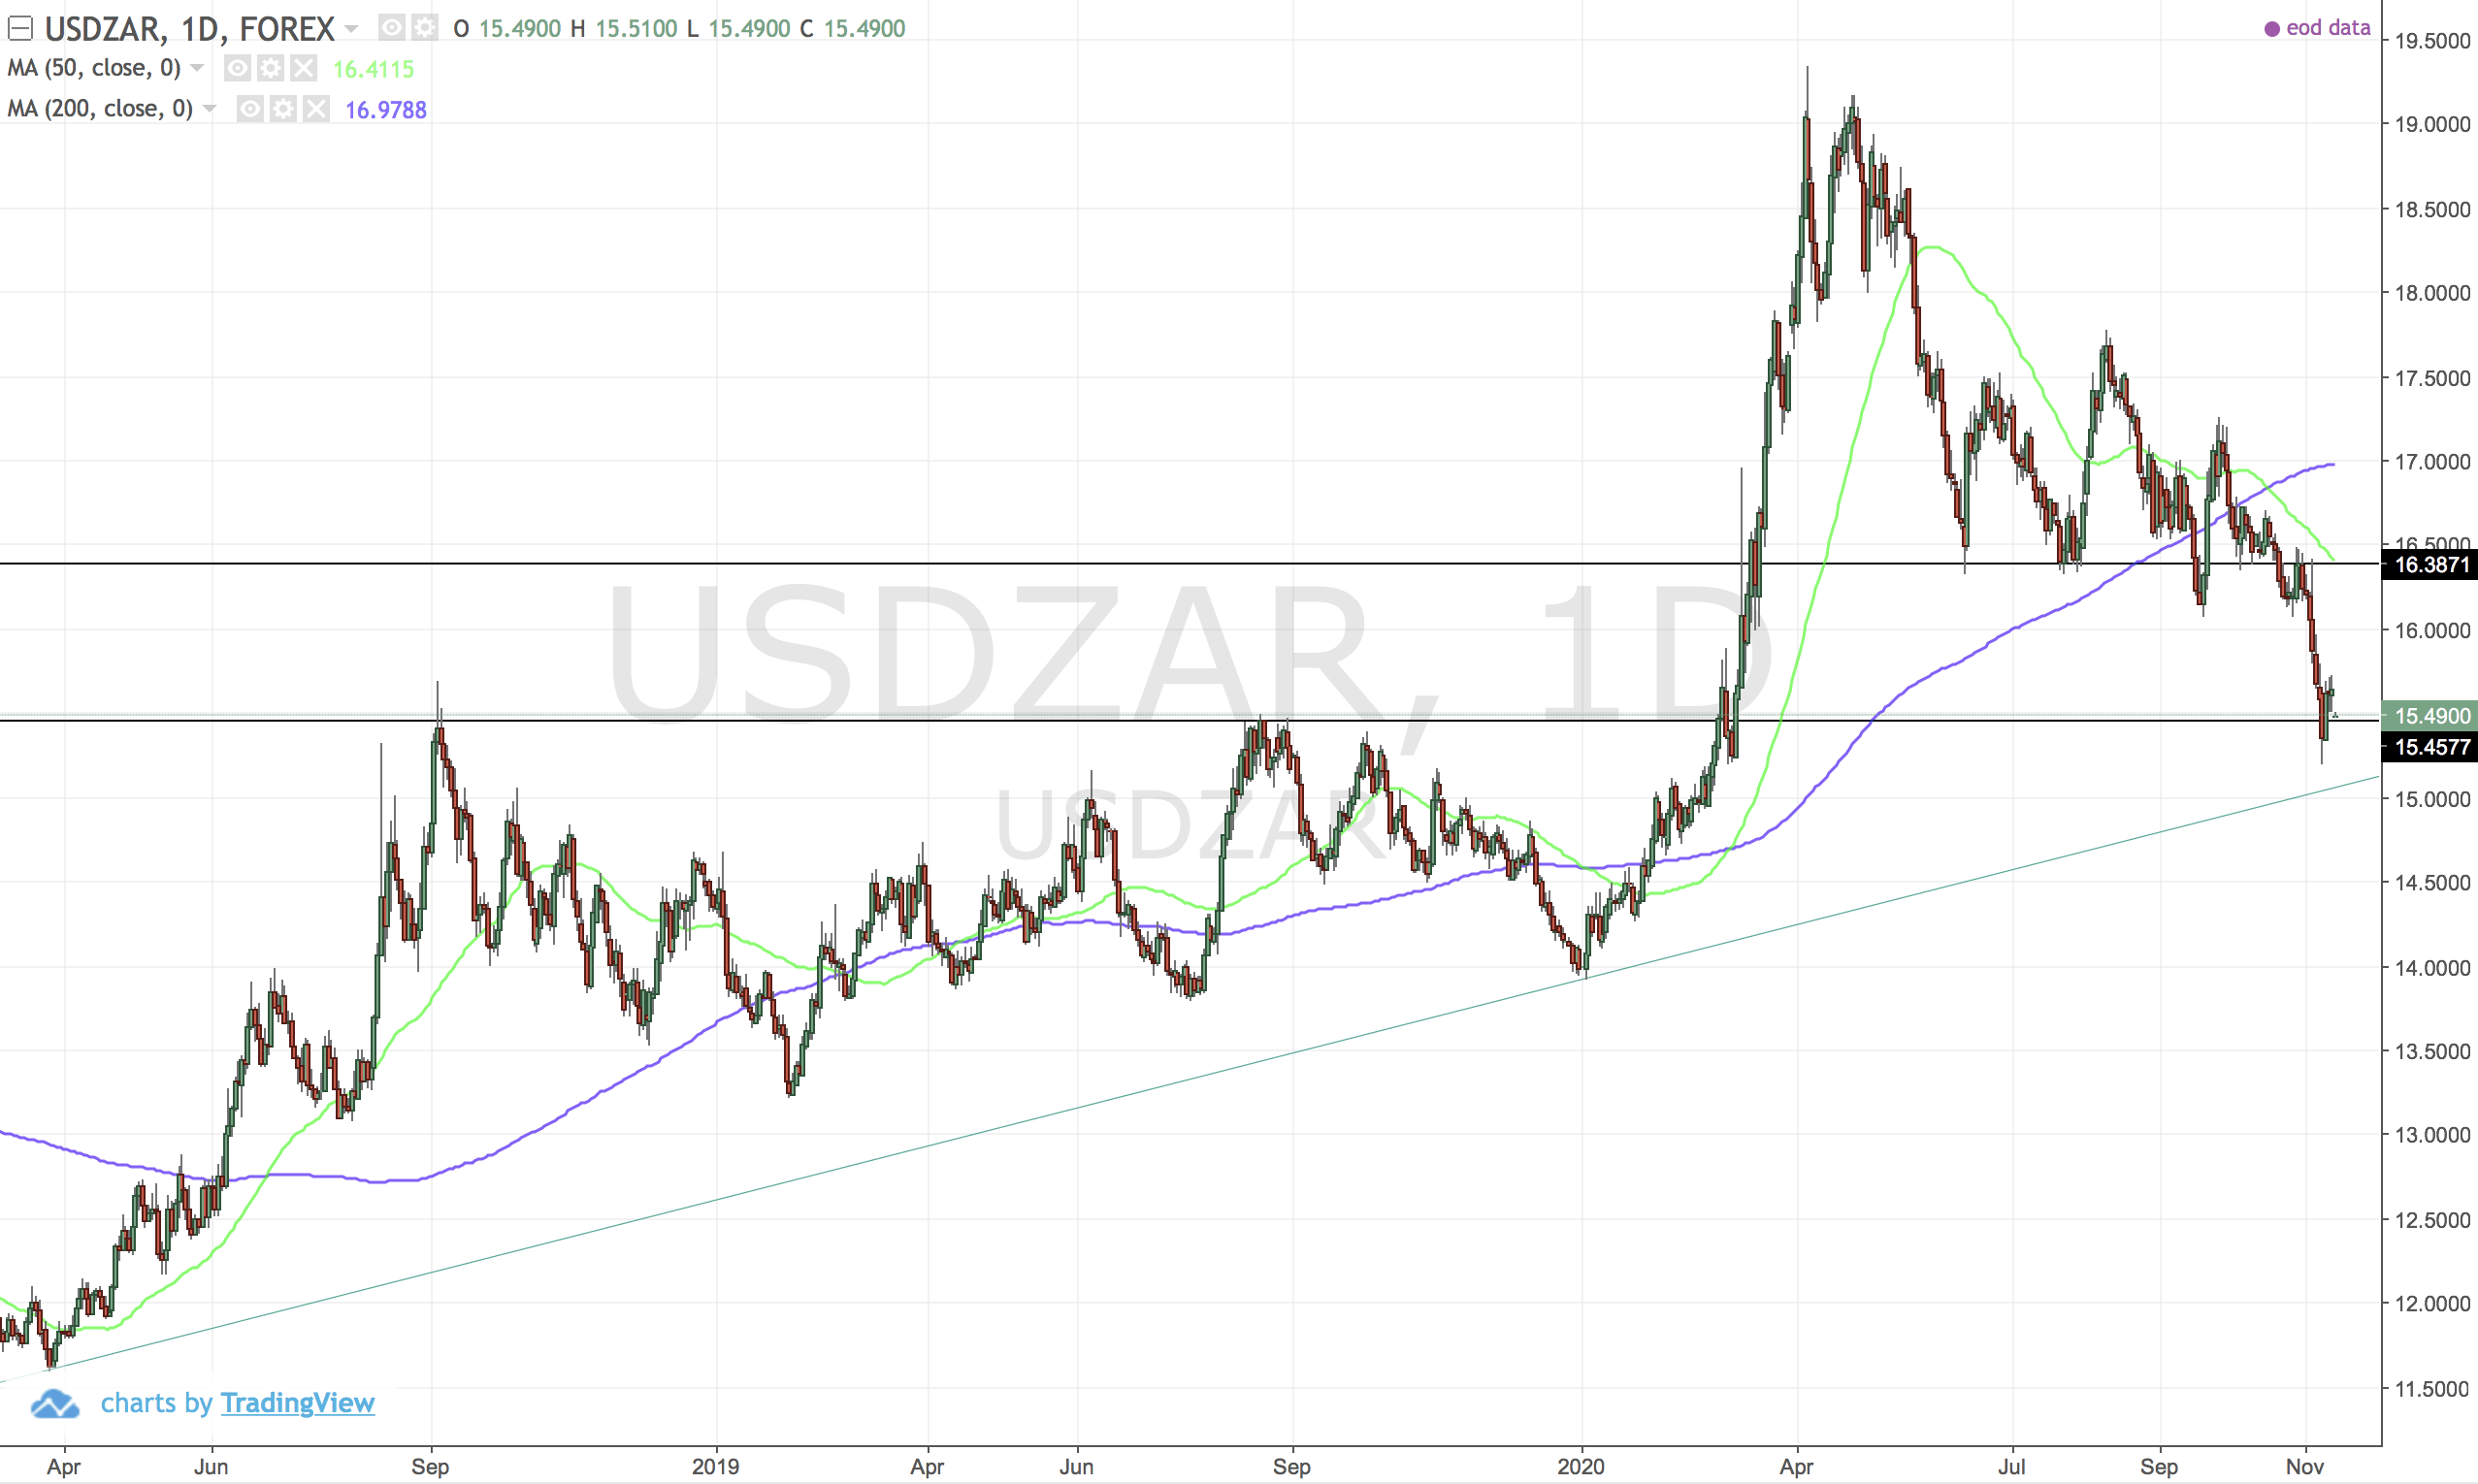
In an area with lots of support.


Comments ()