Breakouts: 9 March 2021
I look at indices, ETF and Gold breakouts

COMM:GC (Gold)
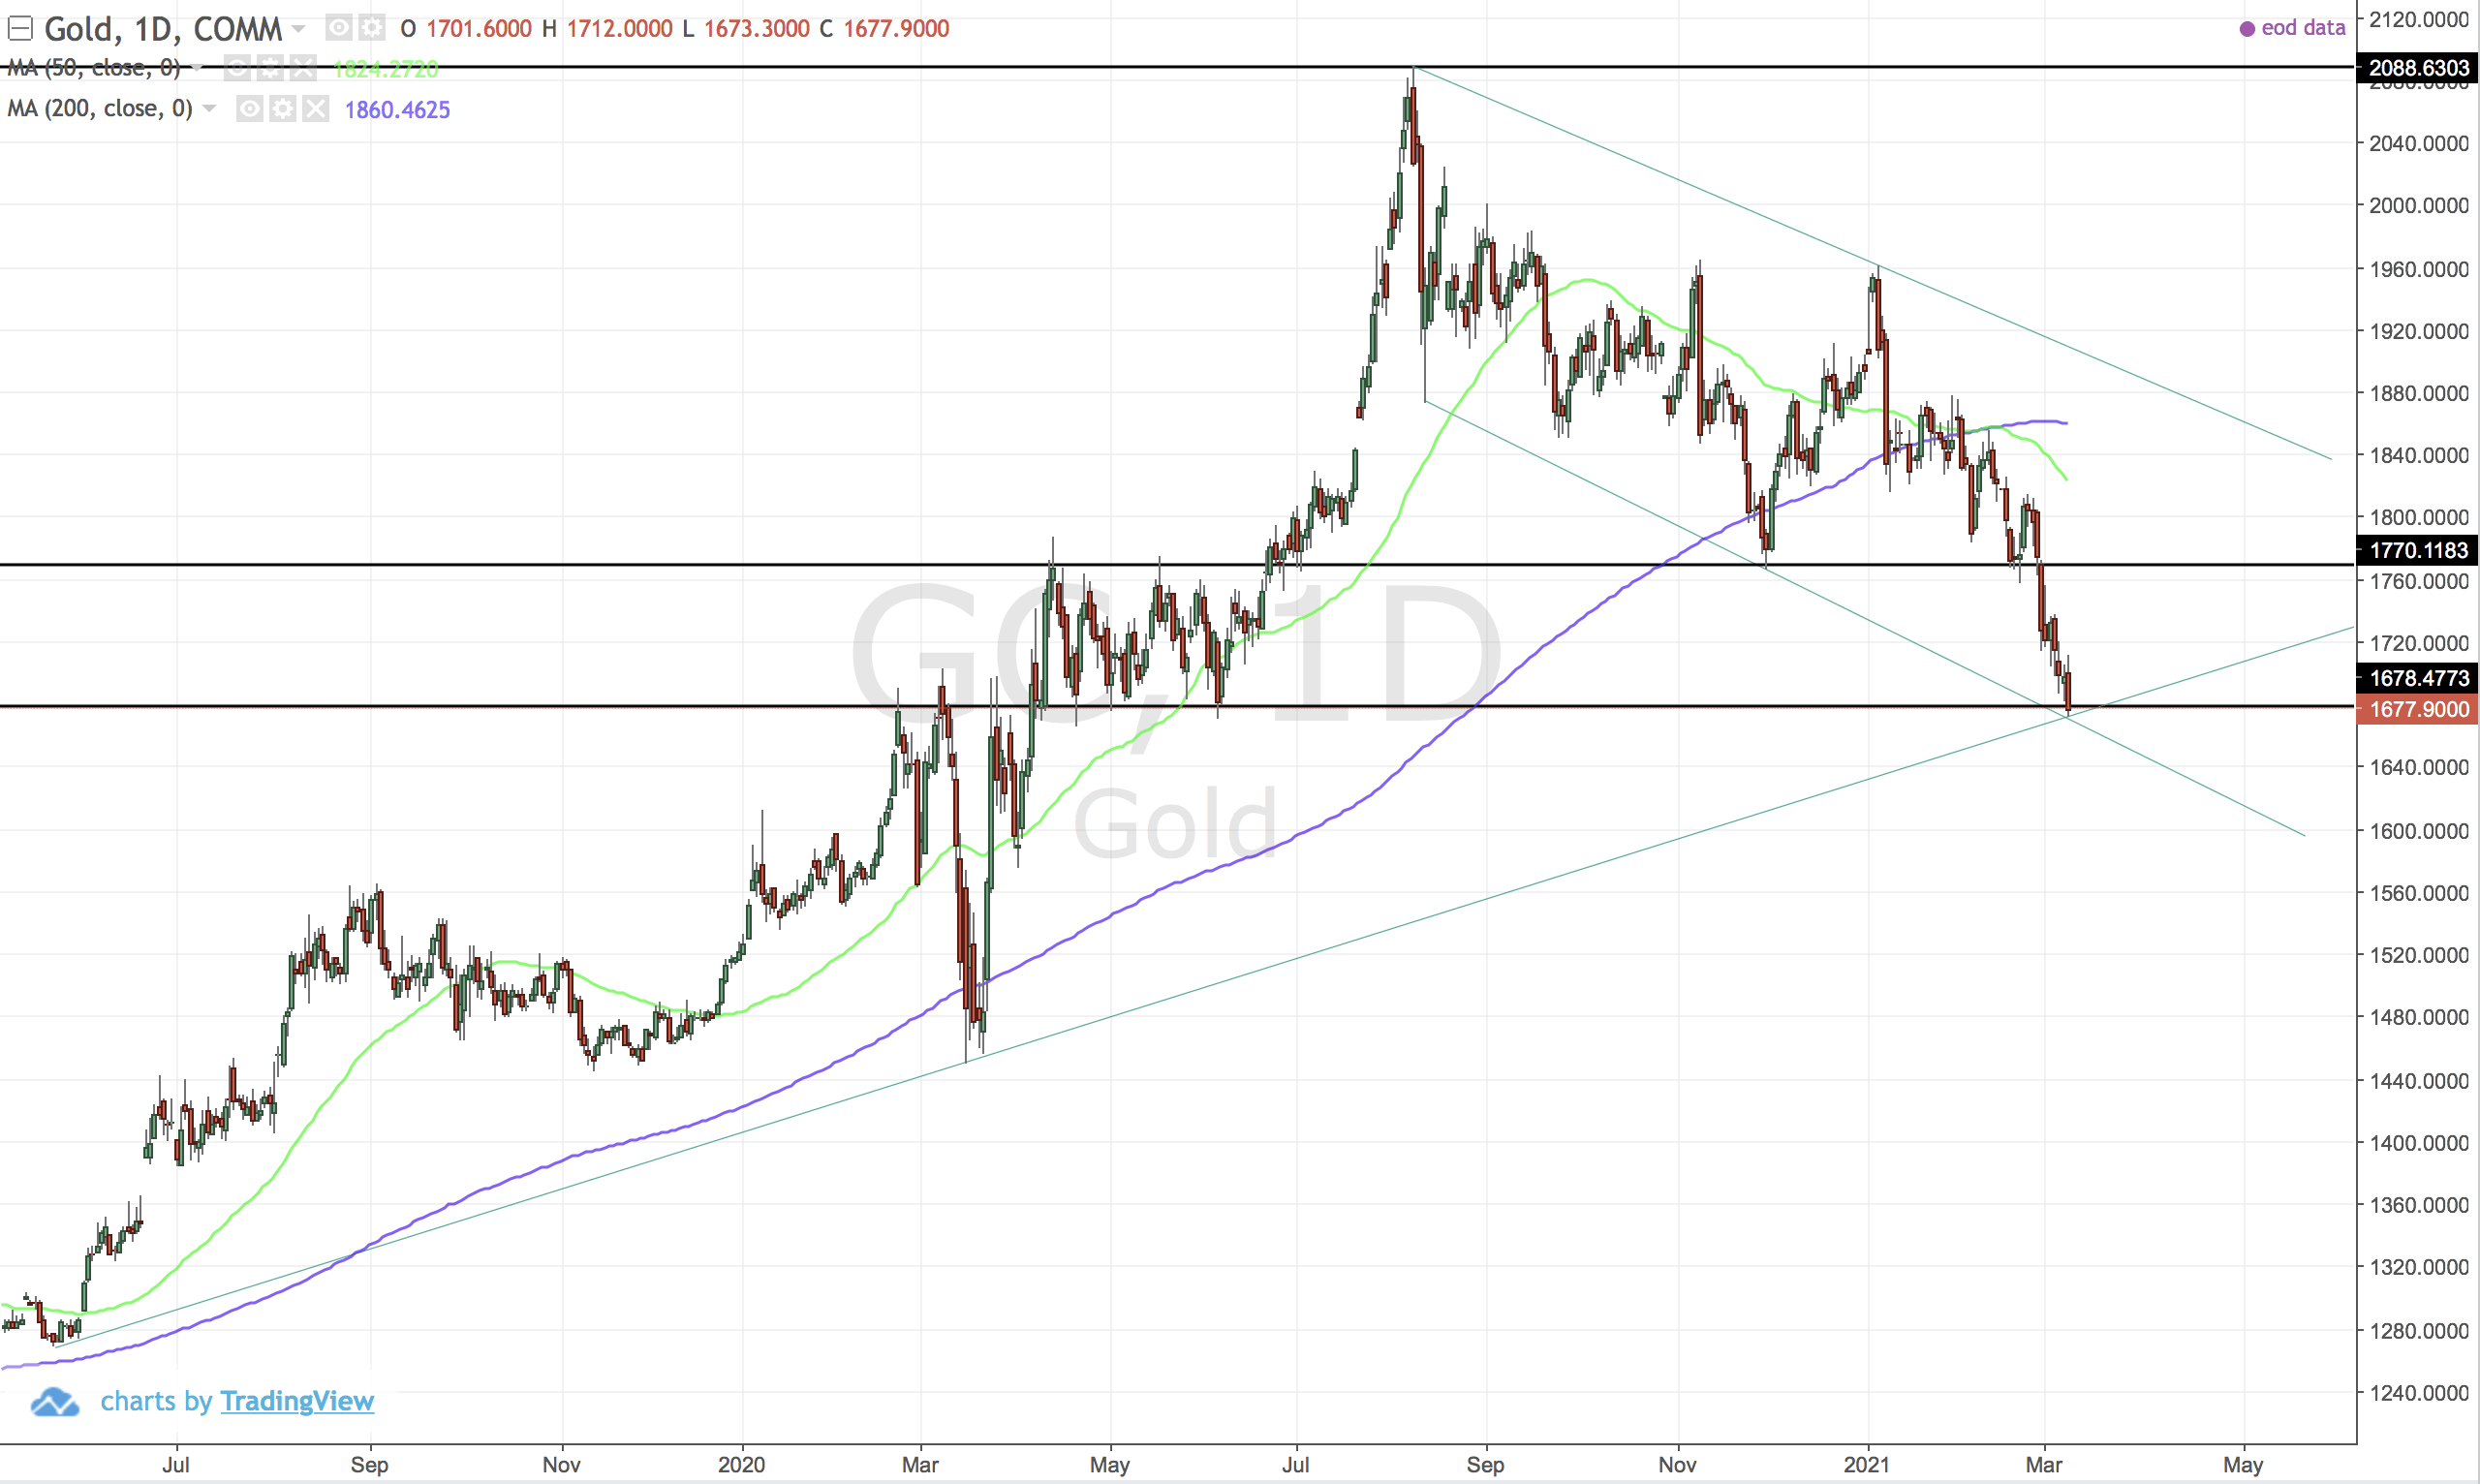
Sitting on a horizontal and trendline support. However I cannot add to a losing trade or a losing chart.
JSE:SYG500 (Sygnia SP500 ETF)
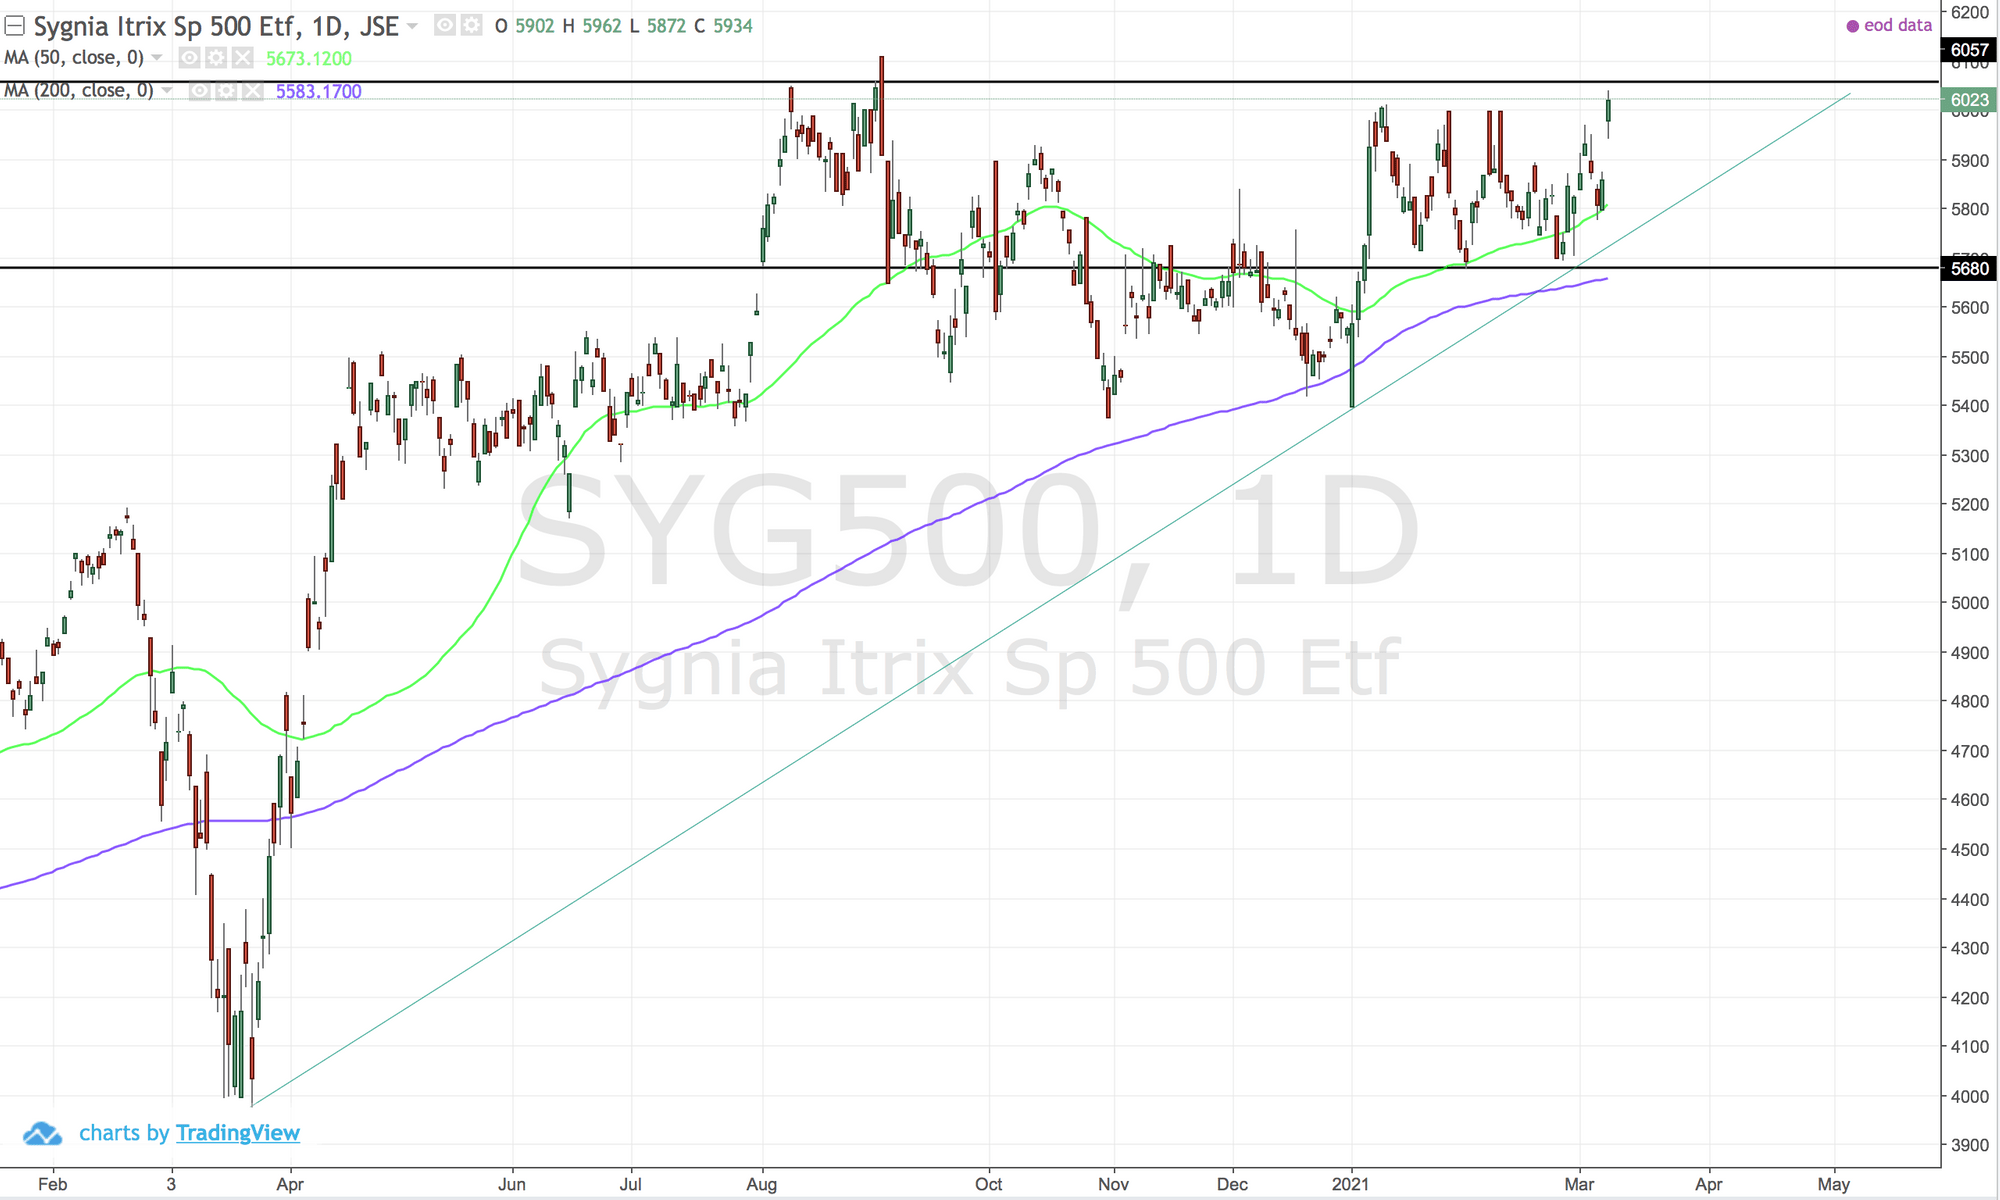
Needs to break above 6064. However it is looking strong and trending up - no harm in entering now.
INDX:DXY (Dollar Index)
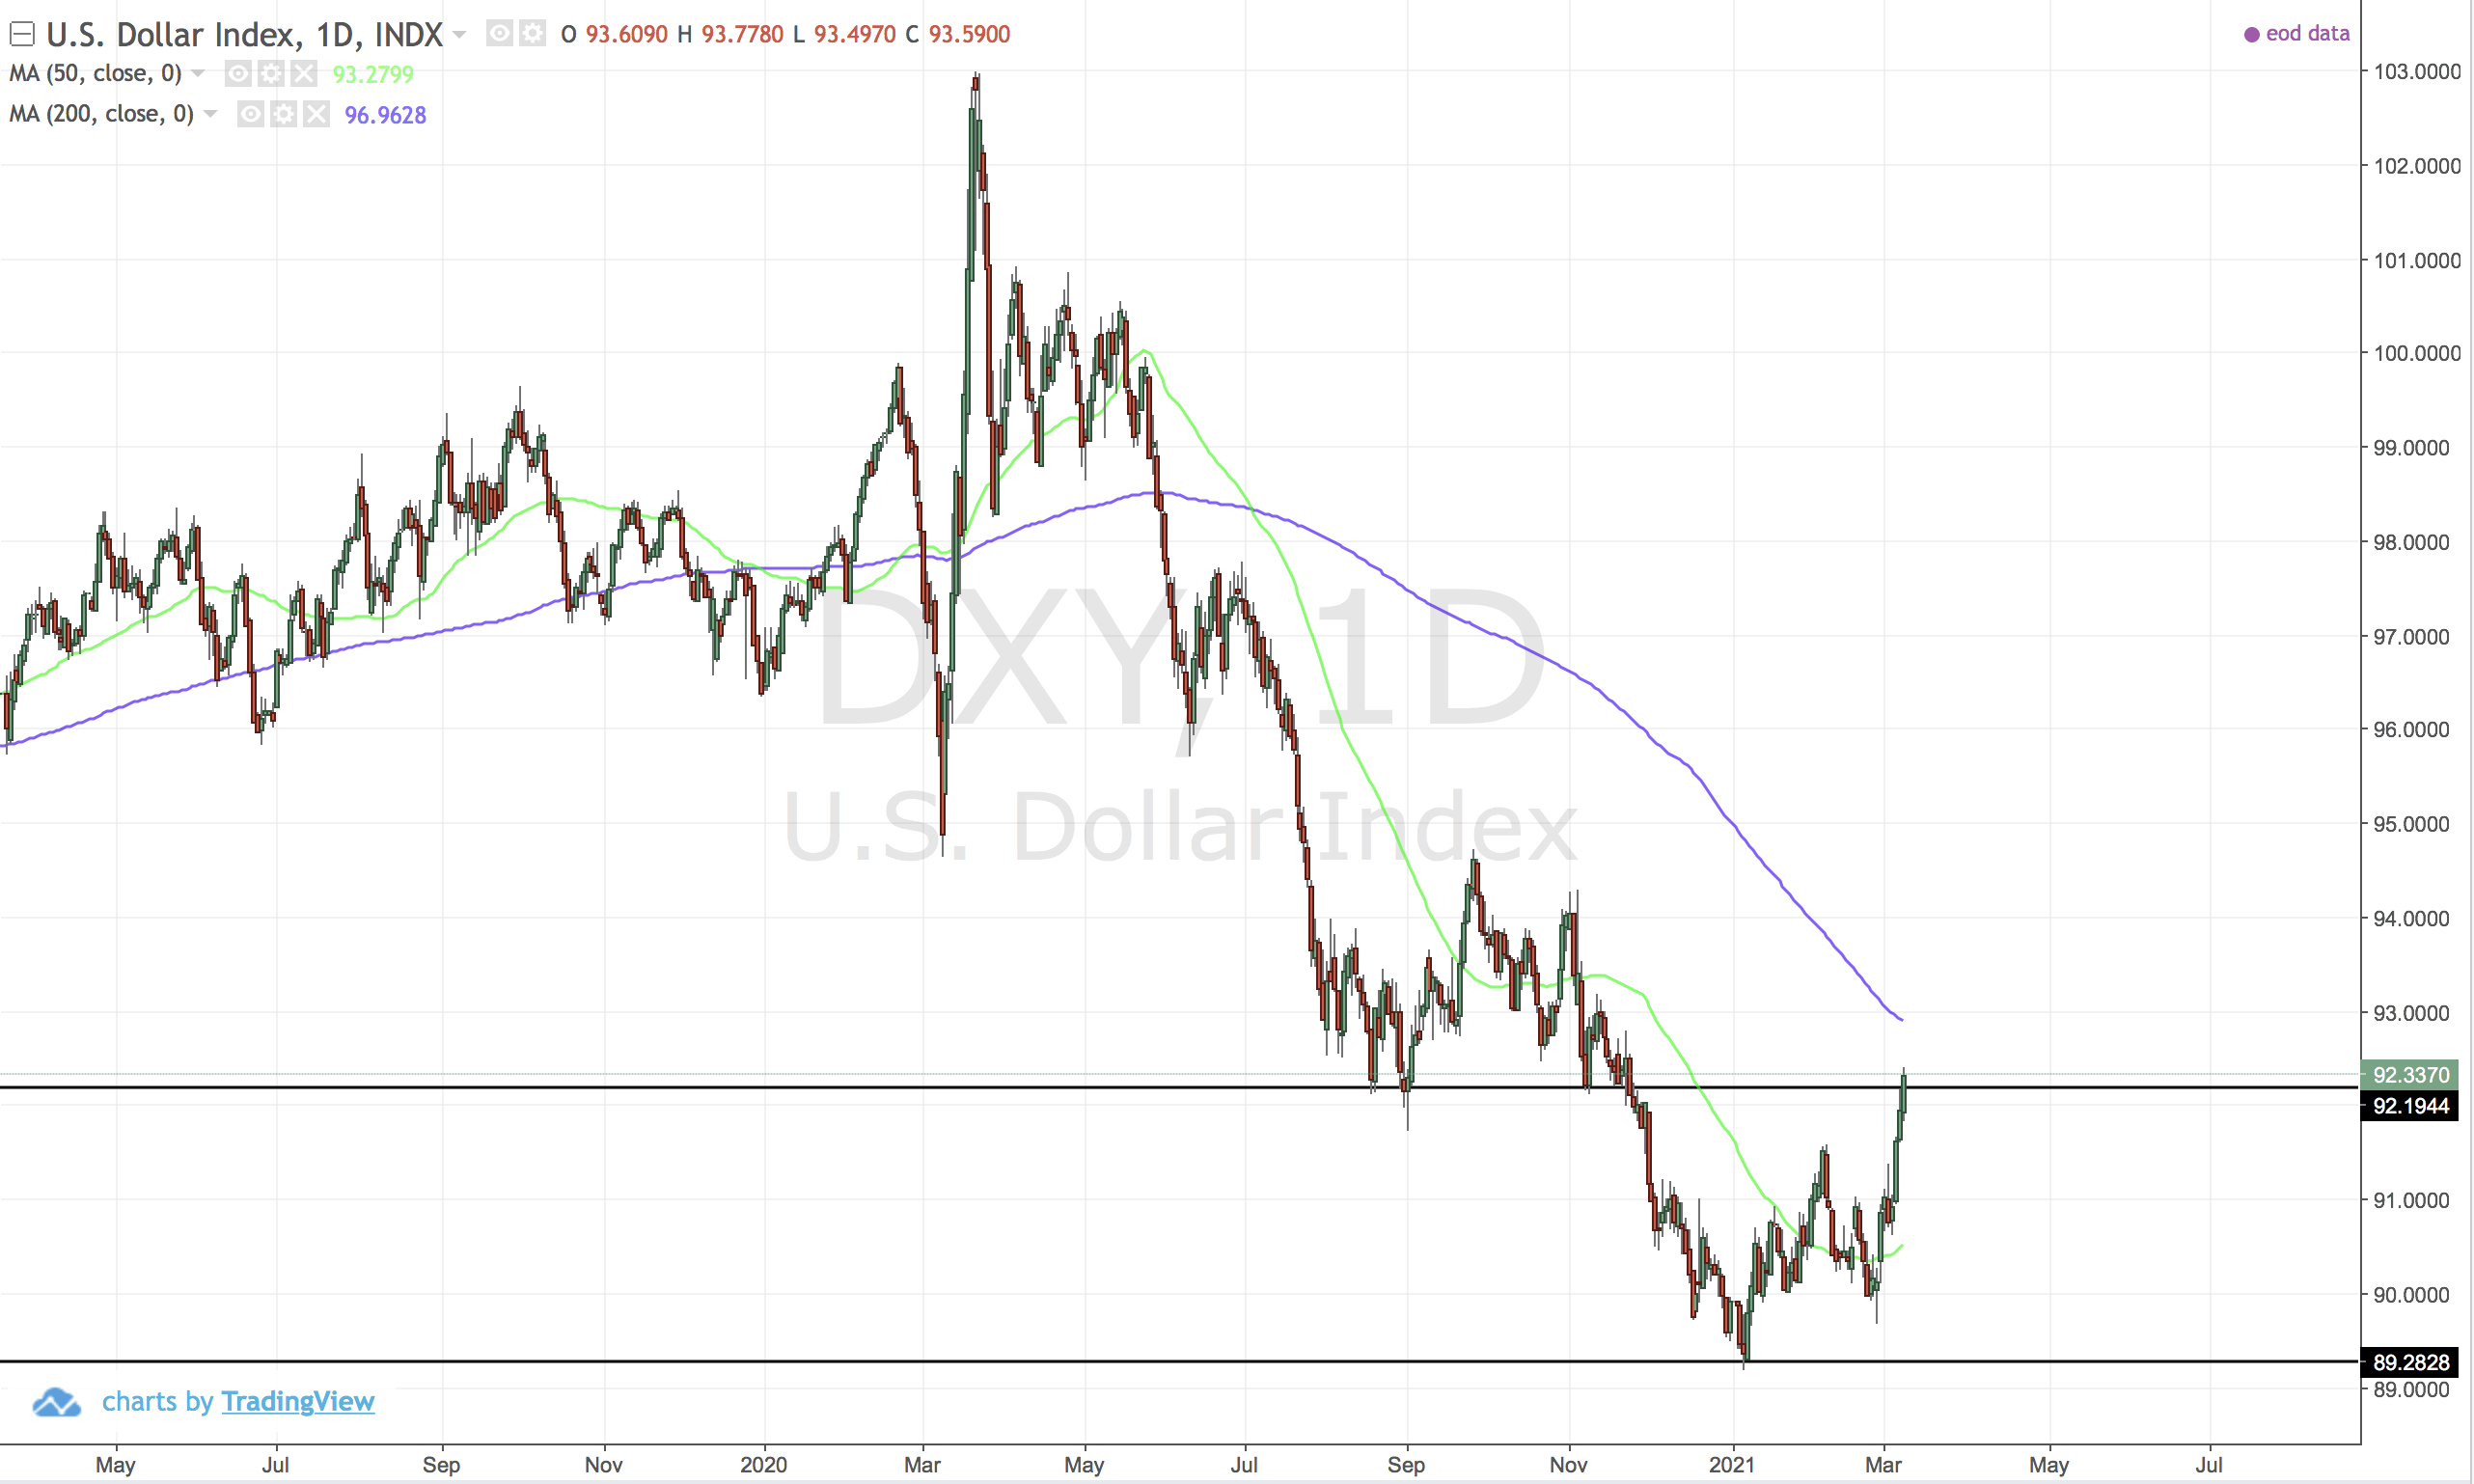
Above horizontal reistance. Higher high and higher low. 50 MA Turning up.
INDX:NDX (Nasdaq100)
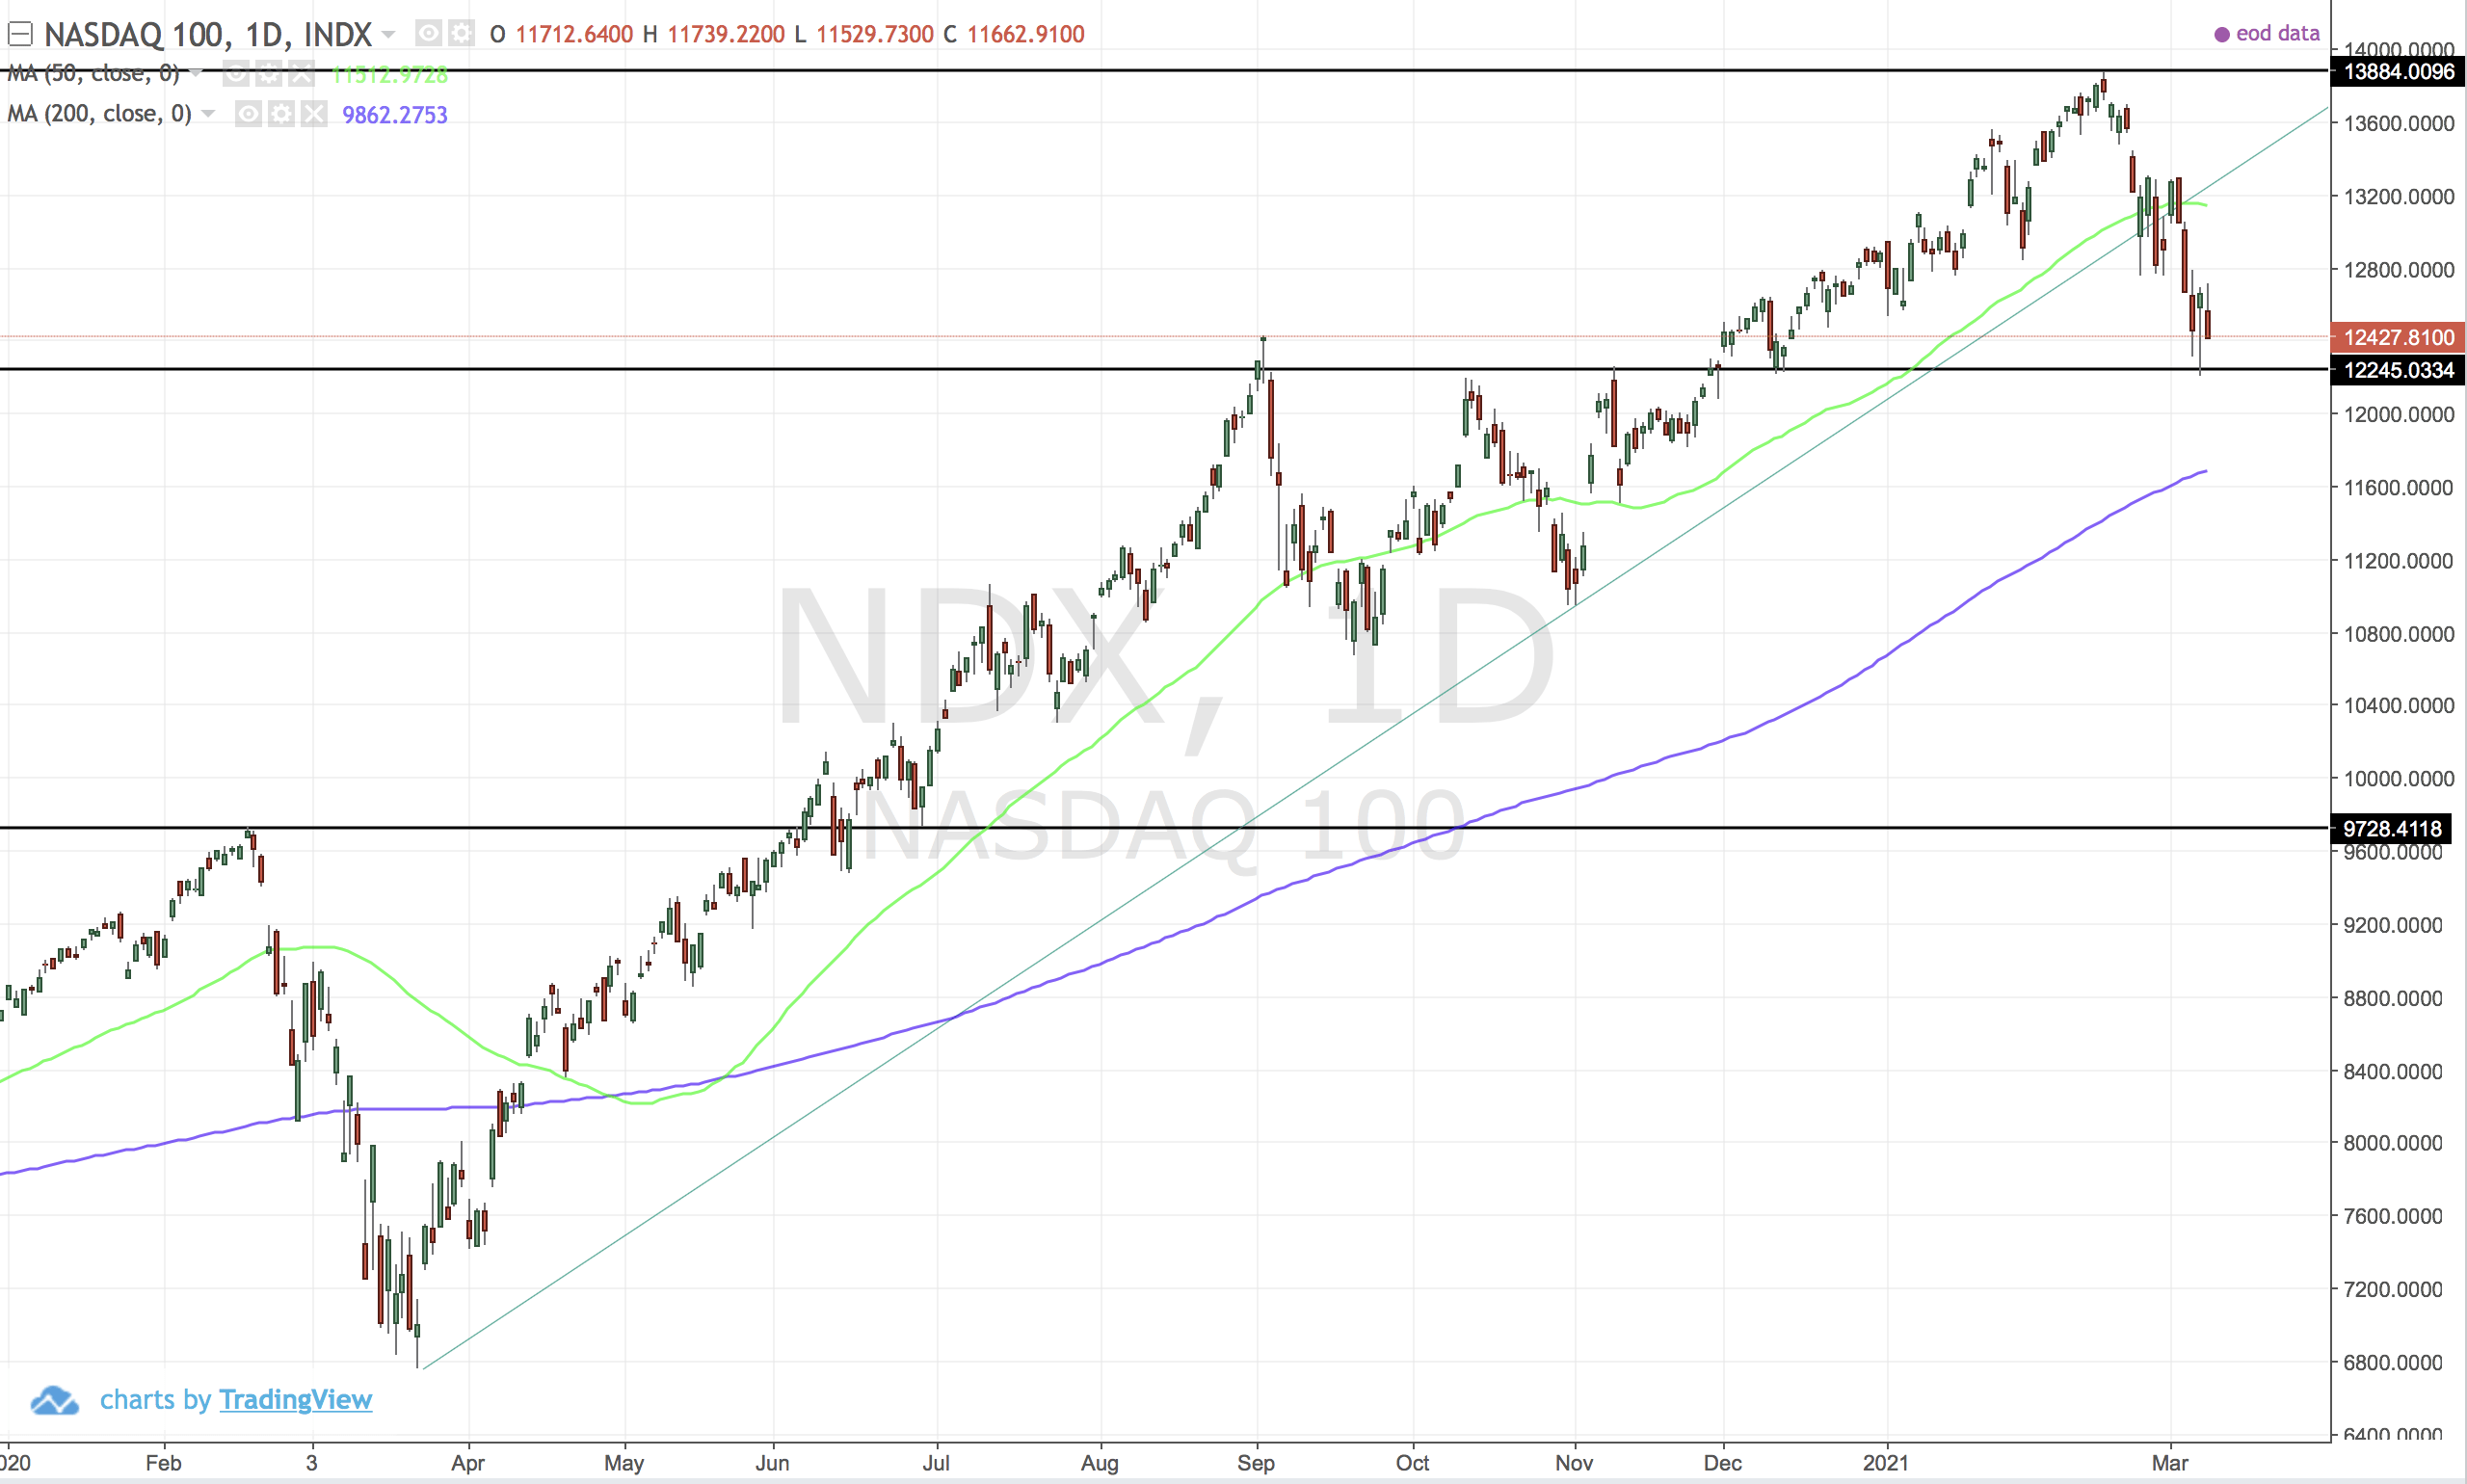
Opportunities like this do not present themselves that often. Certainly worth a punt I think - with a stoploss of course.


Comments ()