Breakouts: 10 November 2020
I take a look at a few breakouts in the tumultuous of late. Top40, USDZAR, Capitec, Massmart, Goldfields, Sibanye, Nvidia and many more

JTOPI (Top 40)
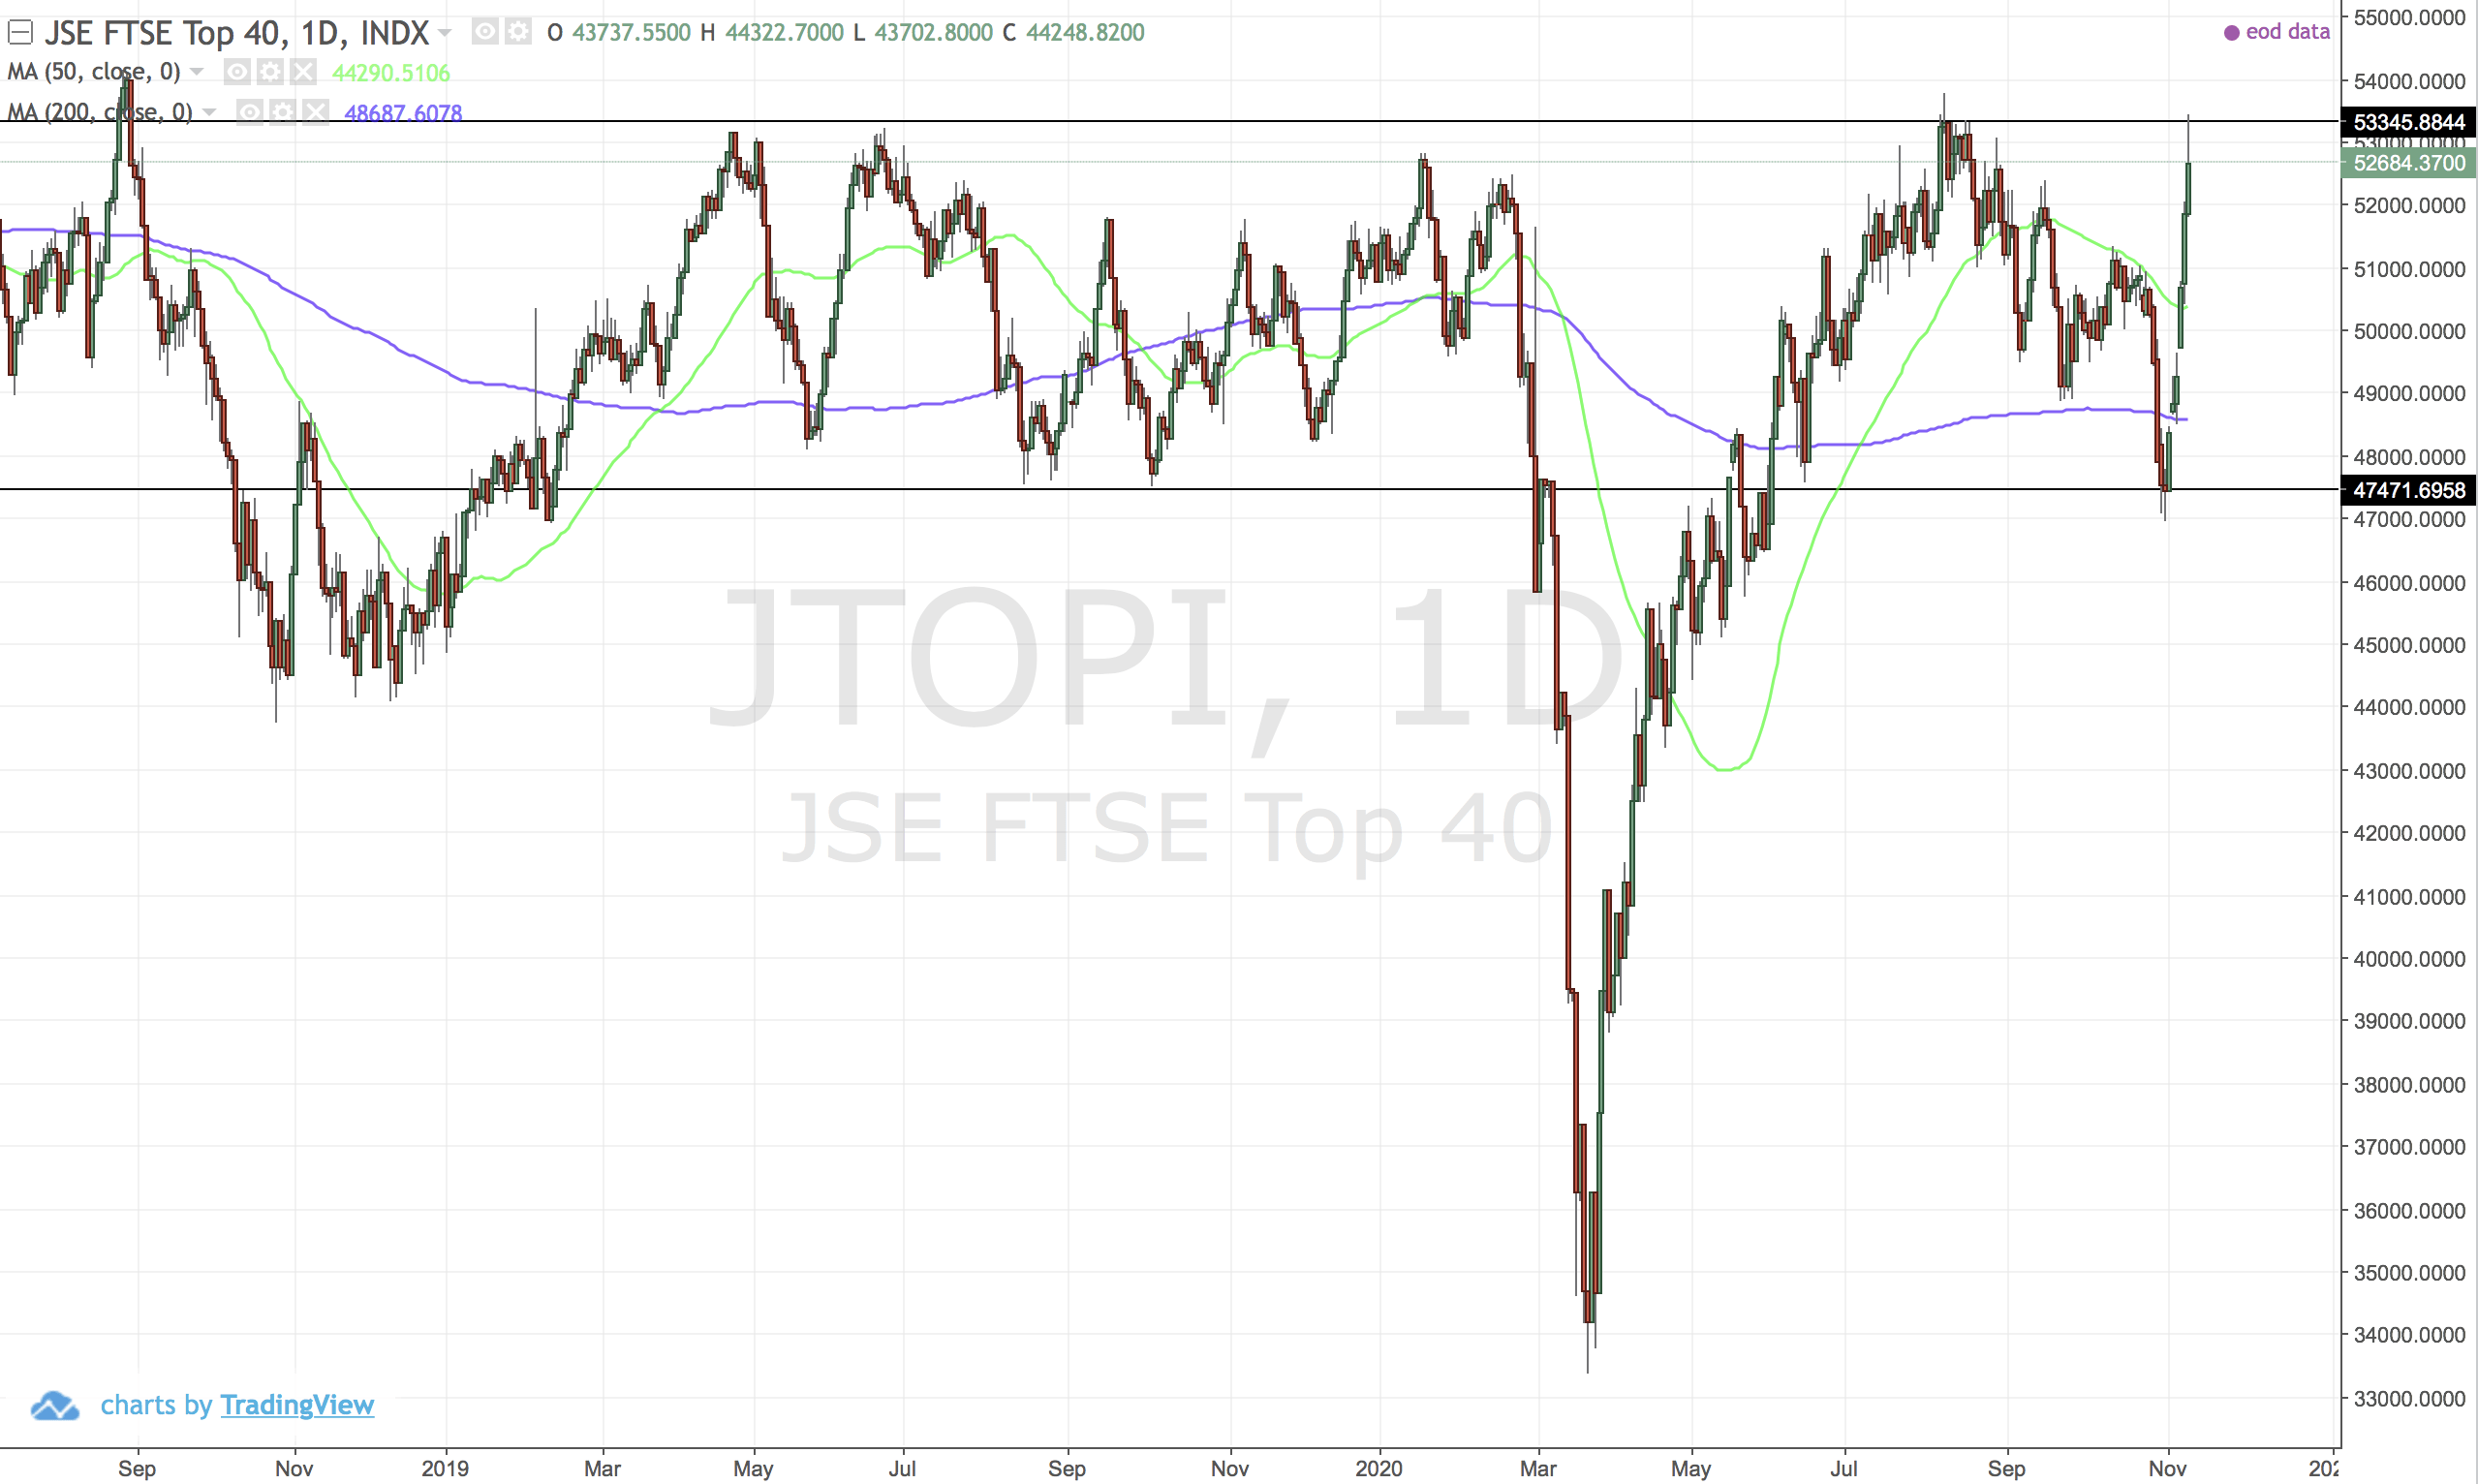
The massive positive candles. This market clearly enjoys having strength against the US dollar...will it last? Some big resistance lines ahead.
USDZAR
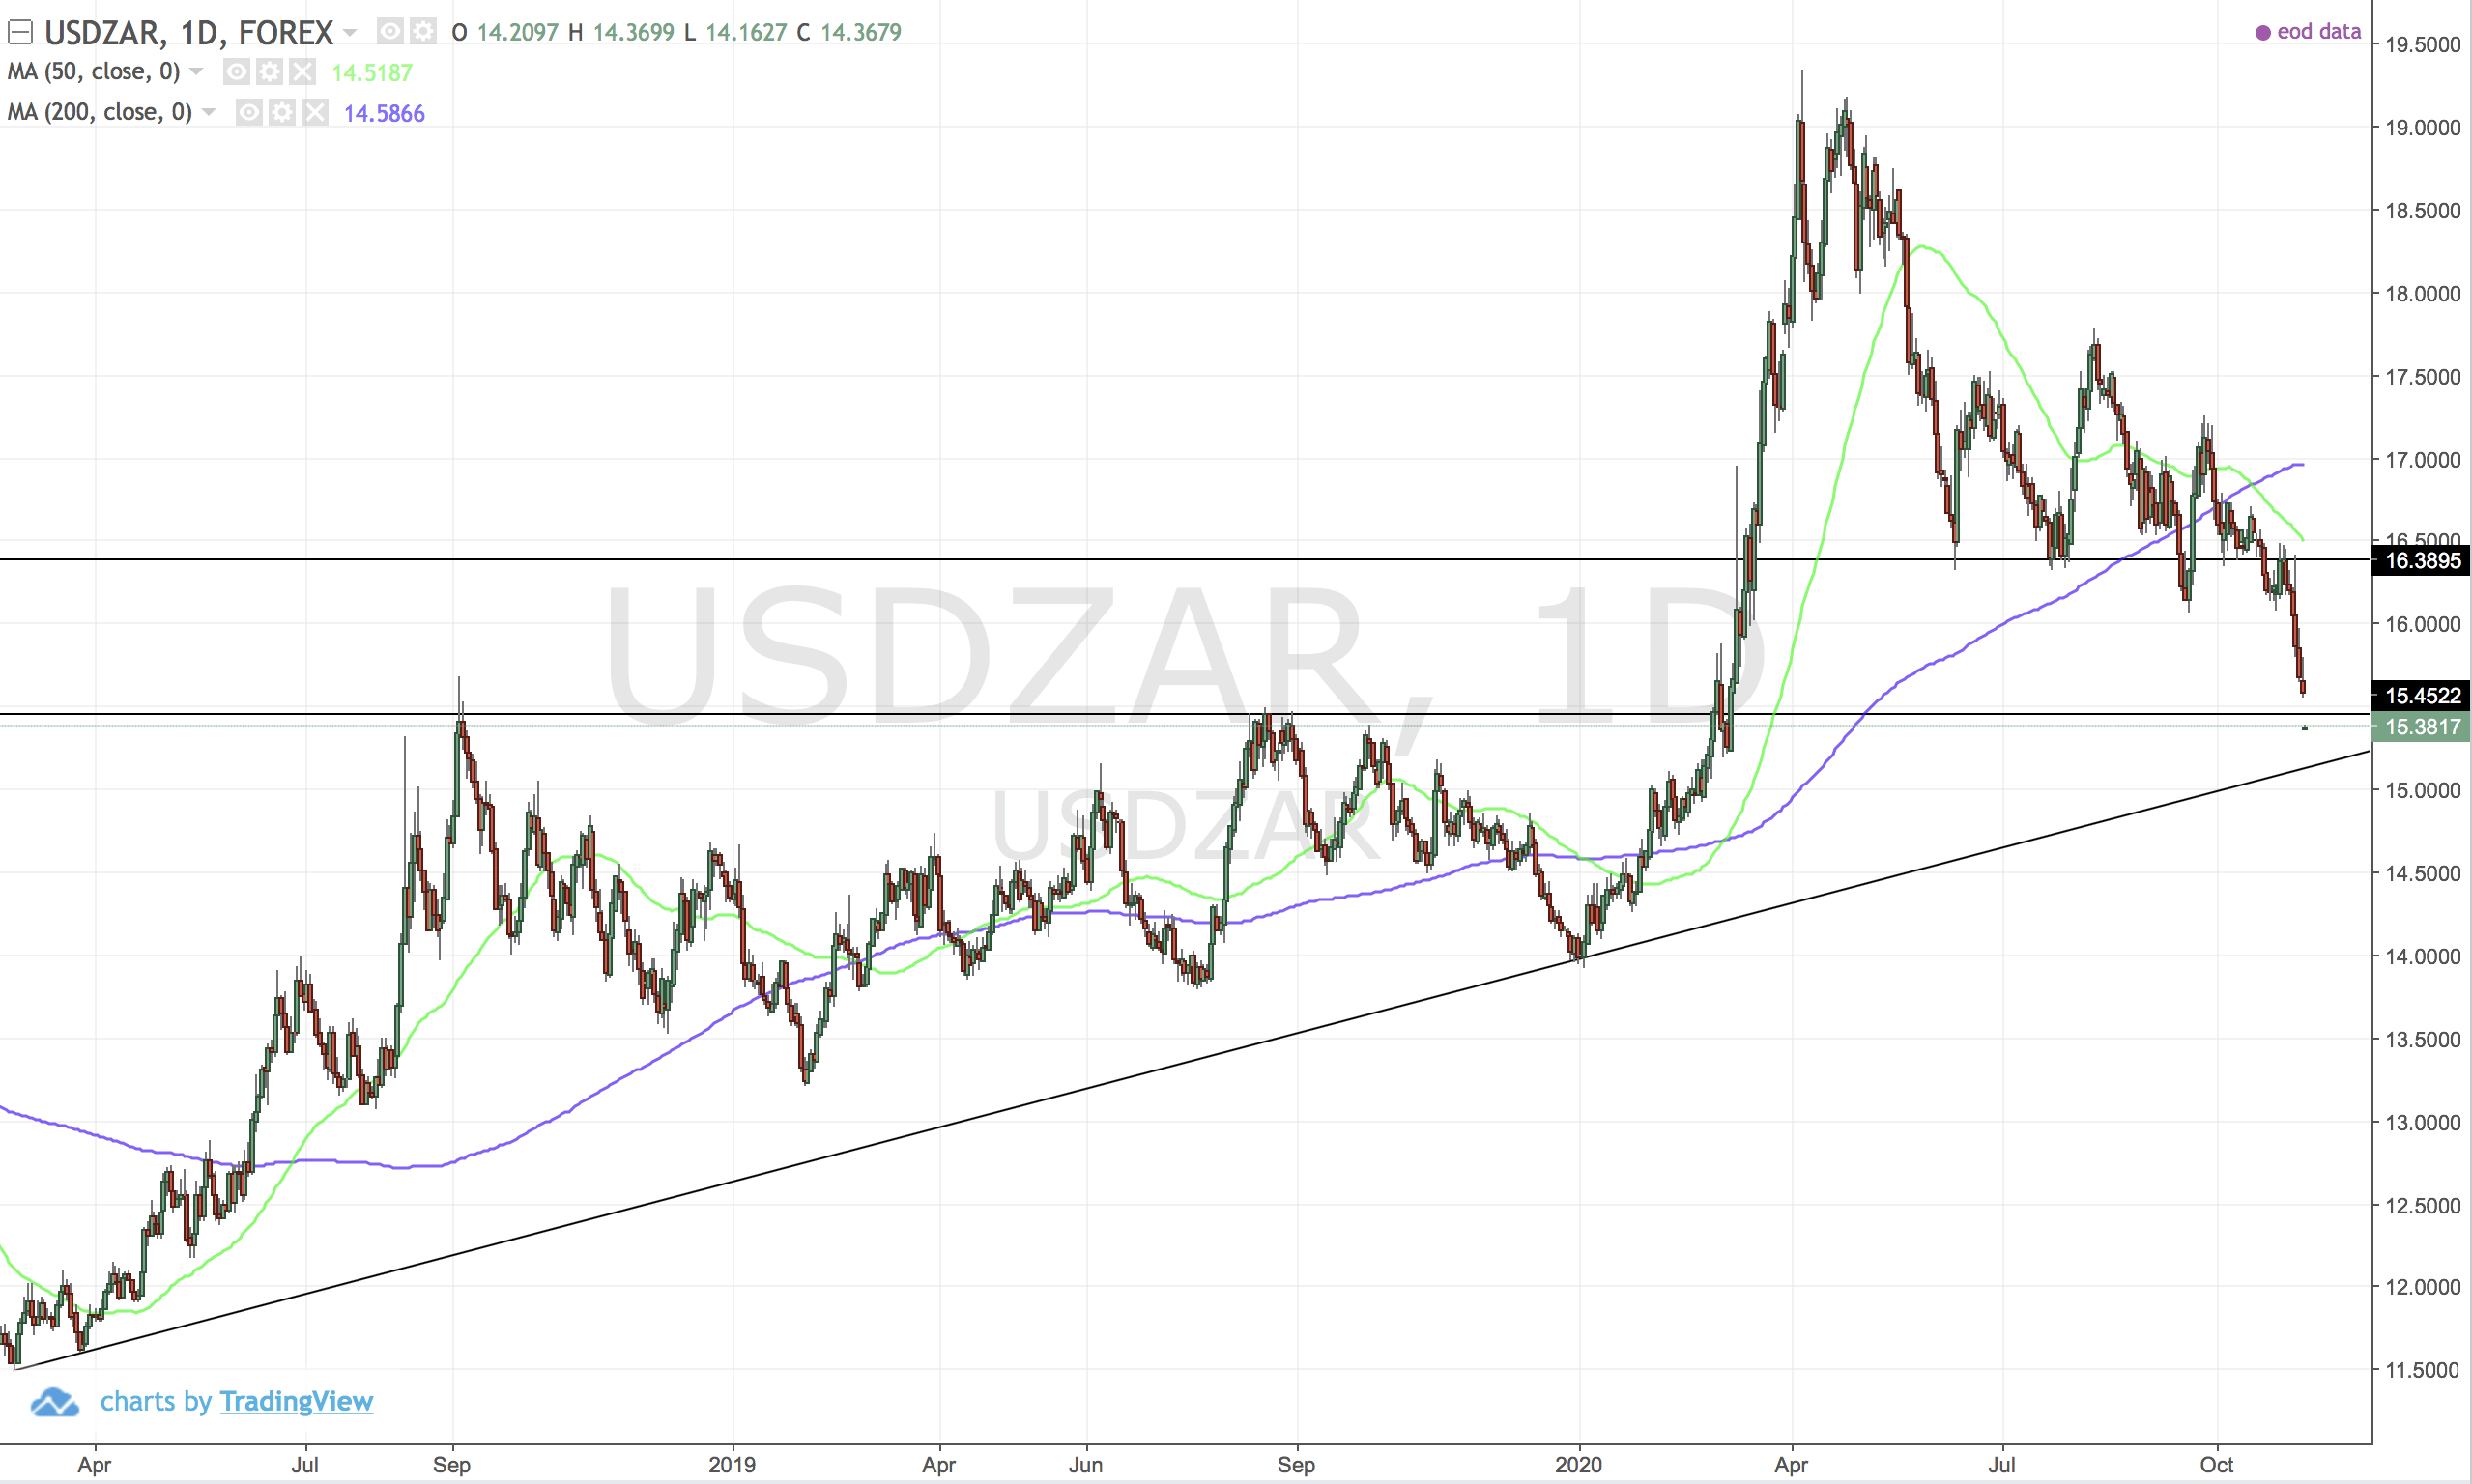
Good time to accumulate in my opinion
US:ITOT (Core SP Total ETF)
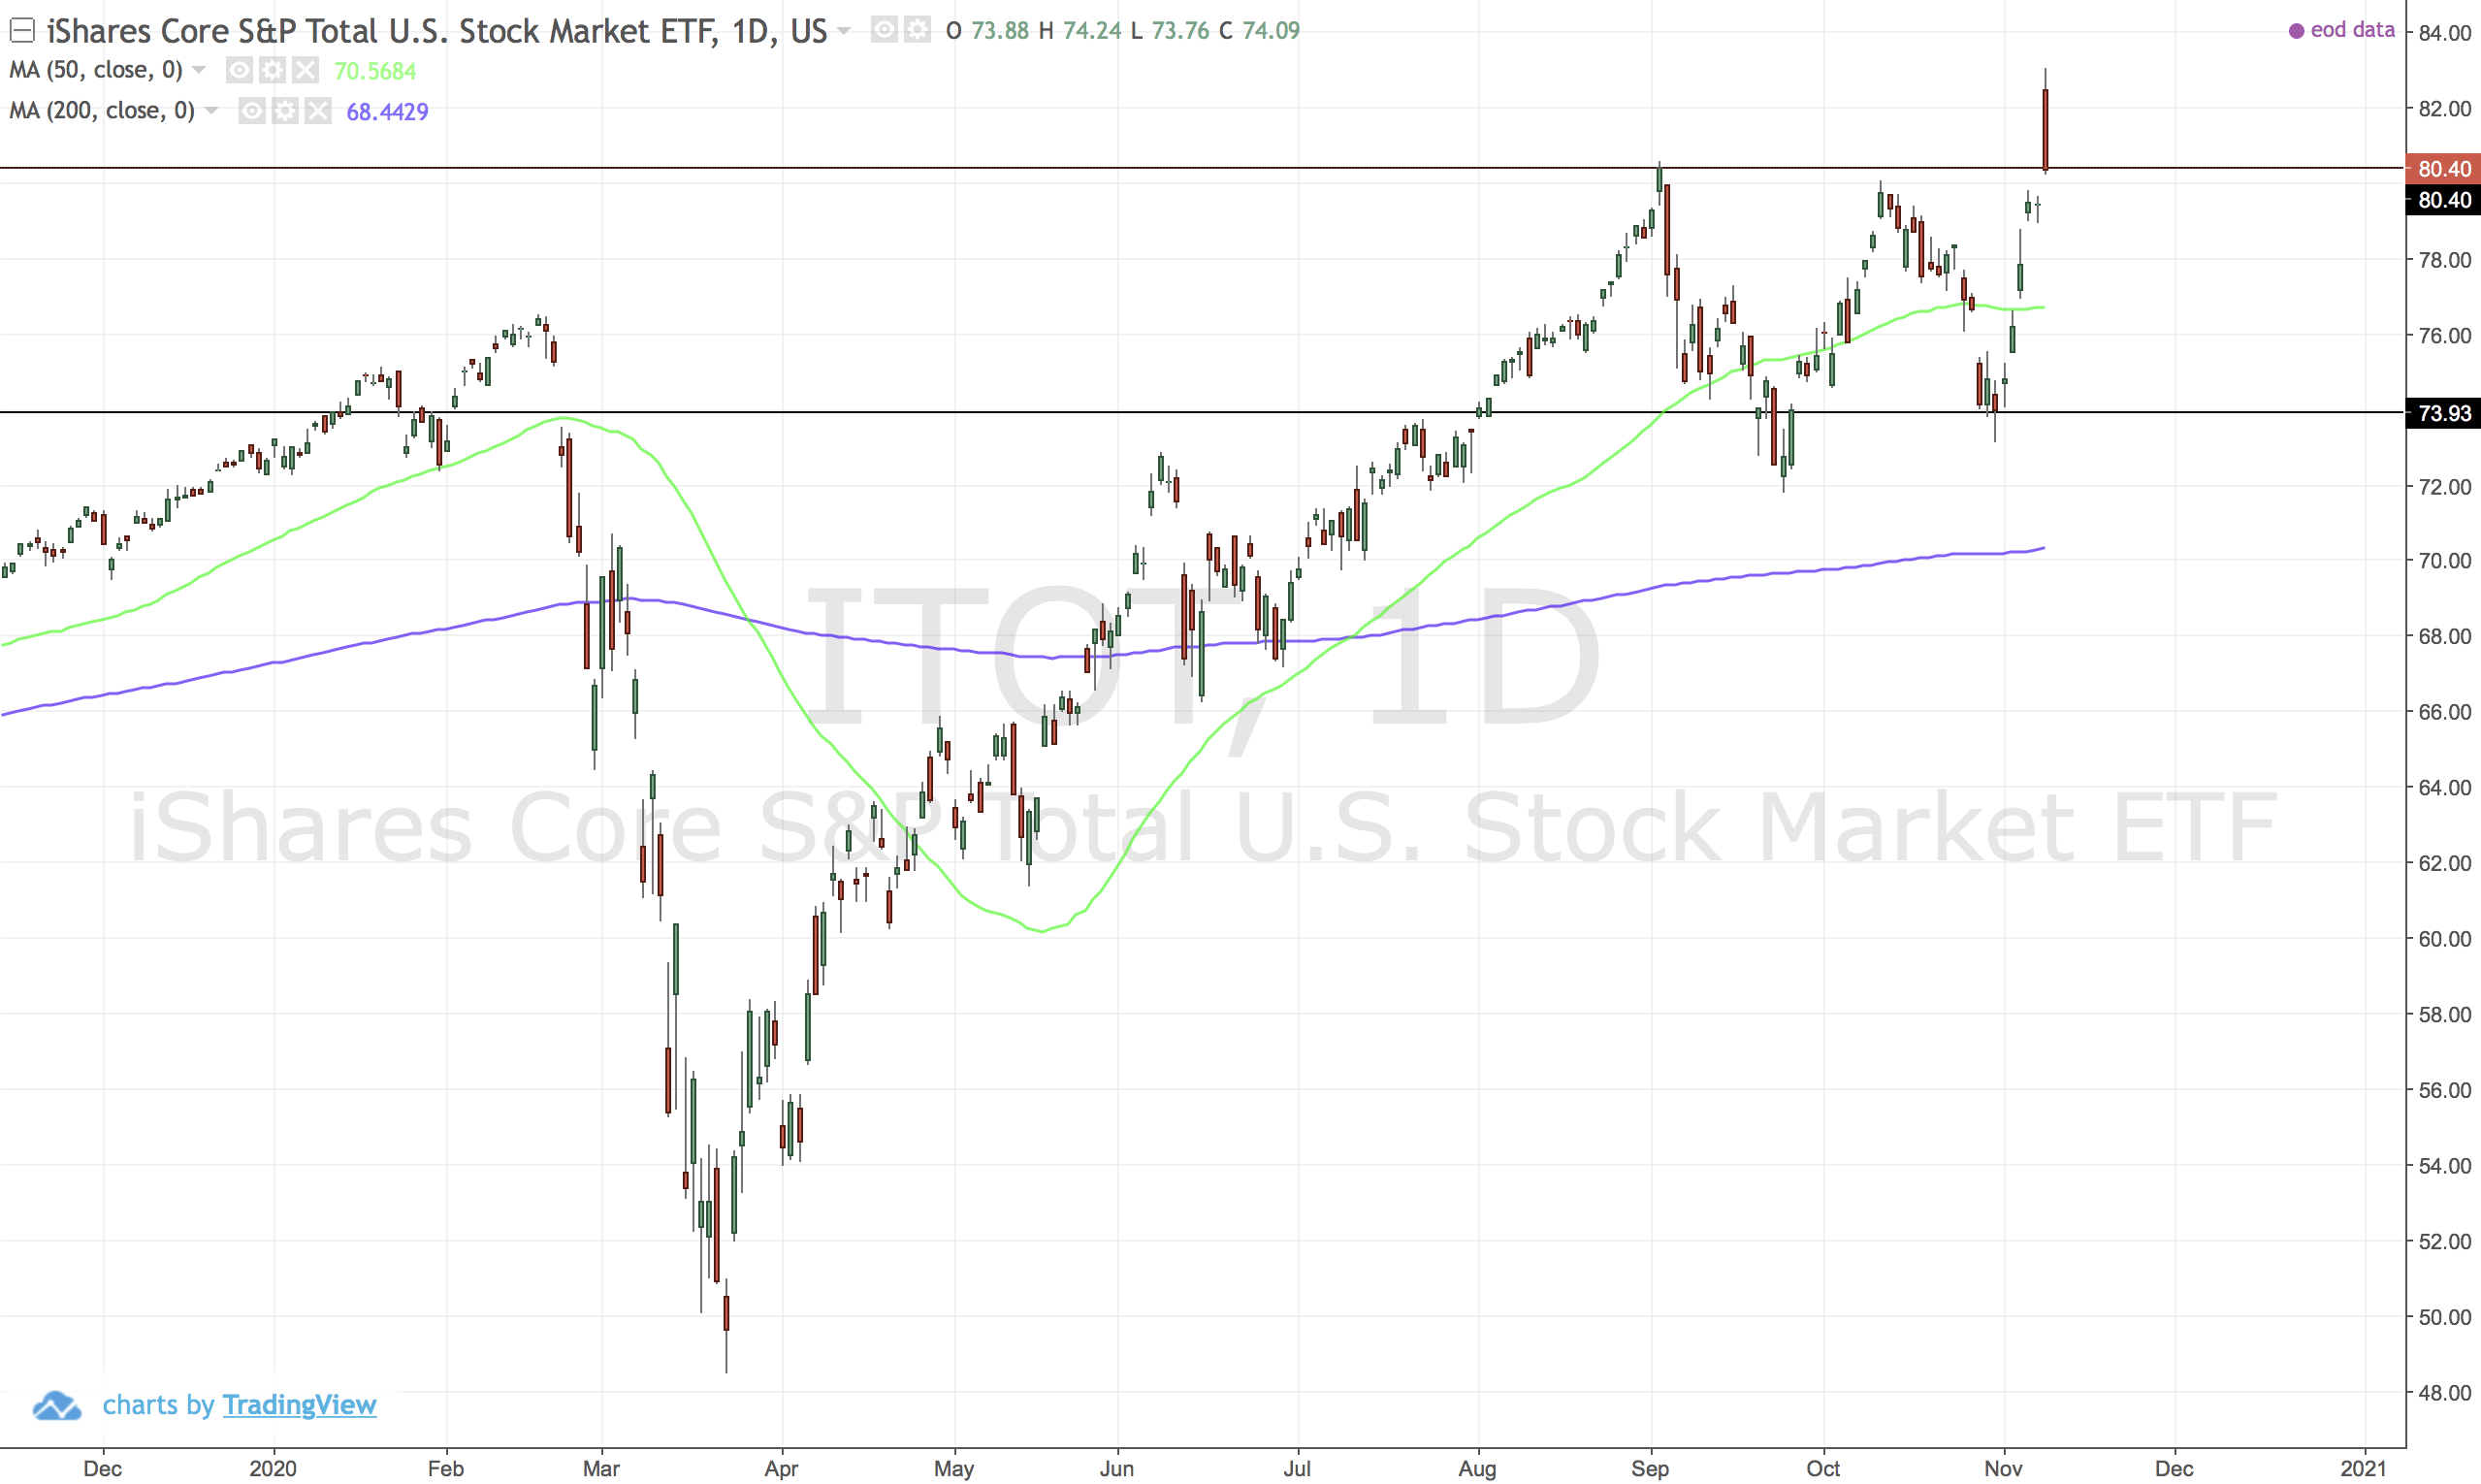
New high breakout but look at that candle. The 200MA is also looking rather flat.
PA (Palladium)
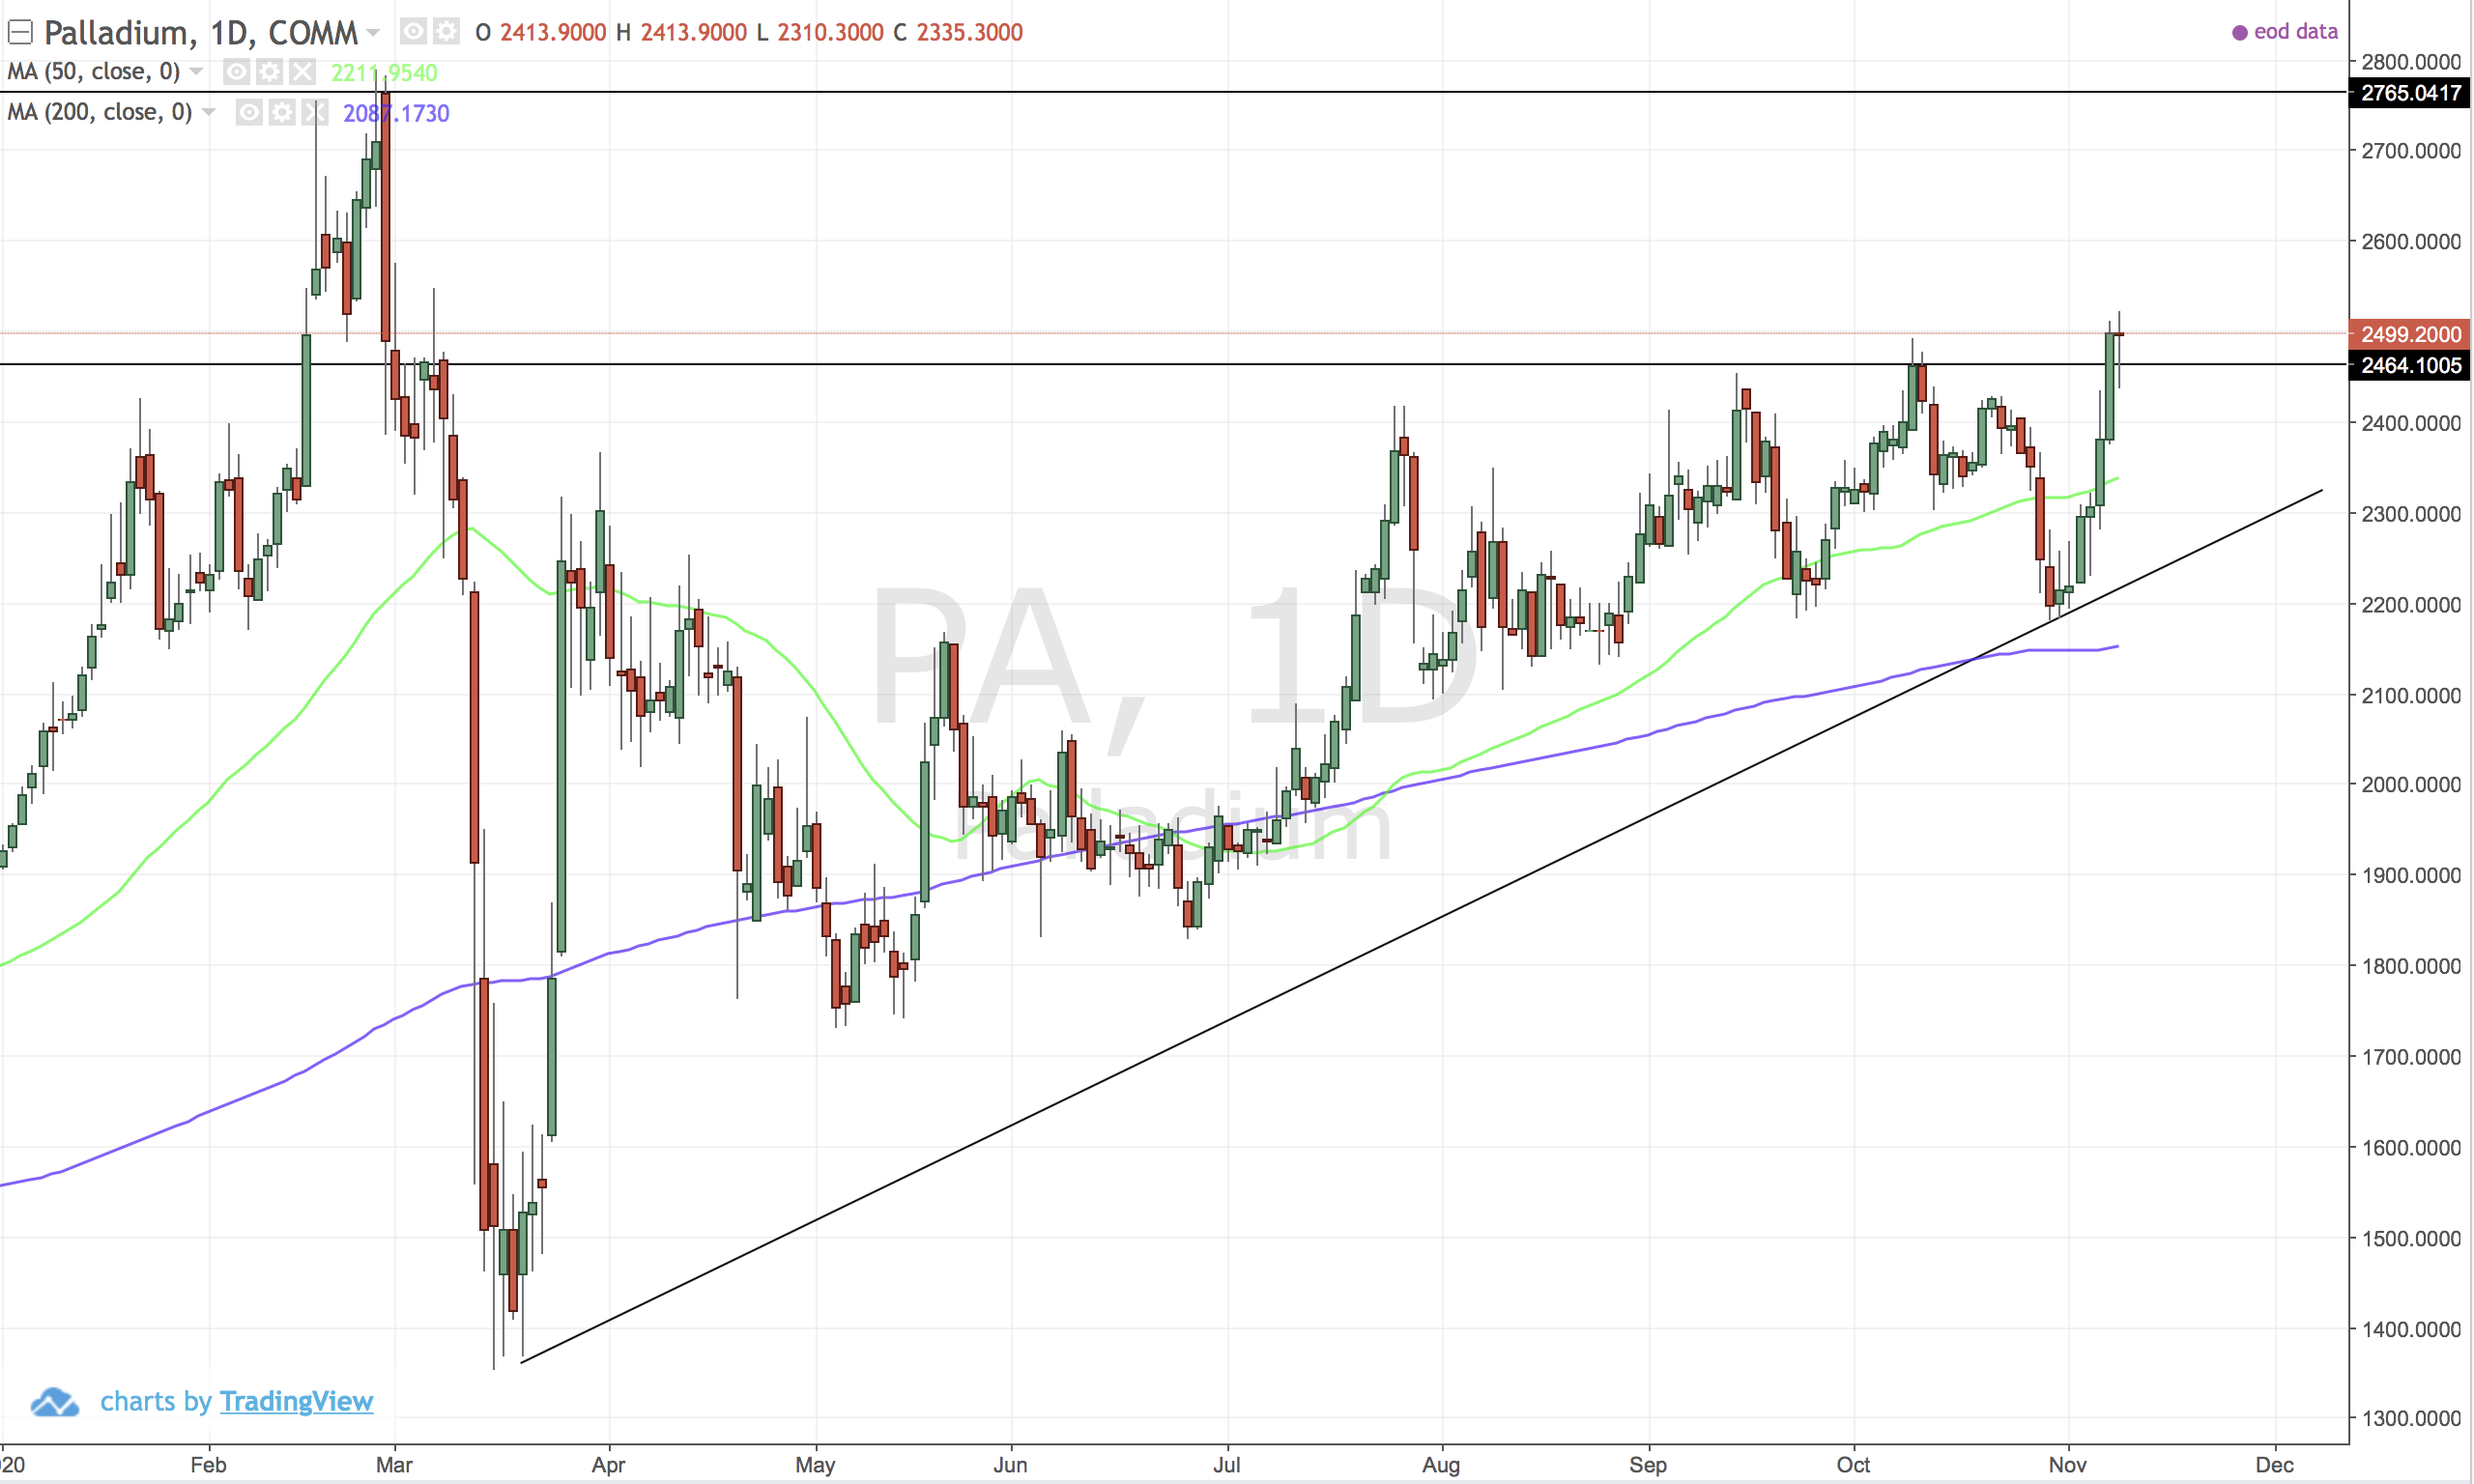
Ascending triangle break, looking very good for a move above 2780.
GRT (Growth Point)
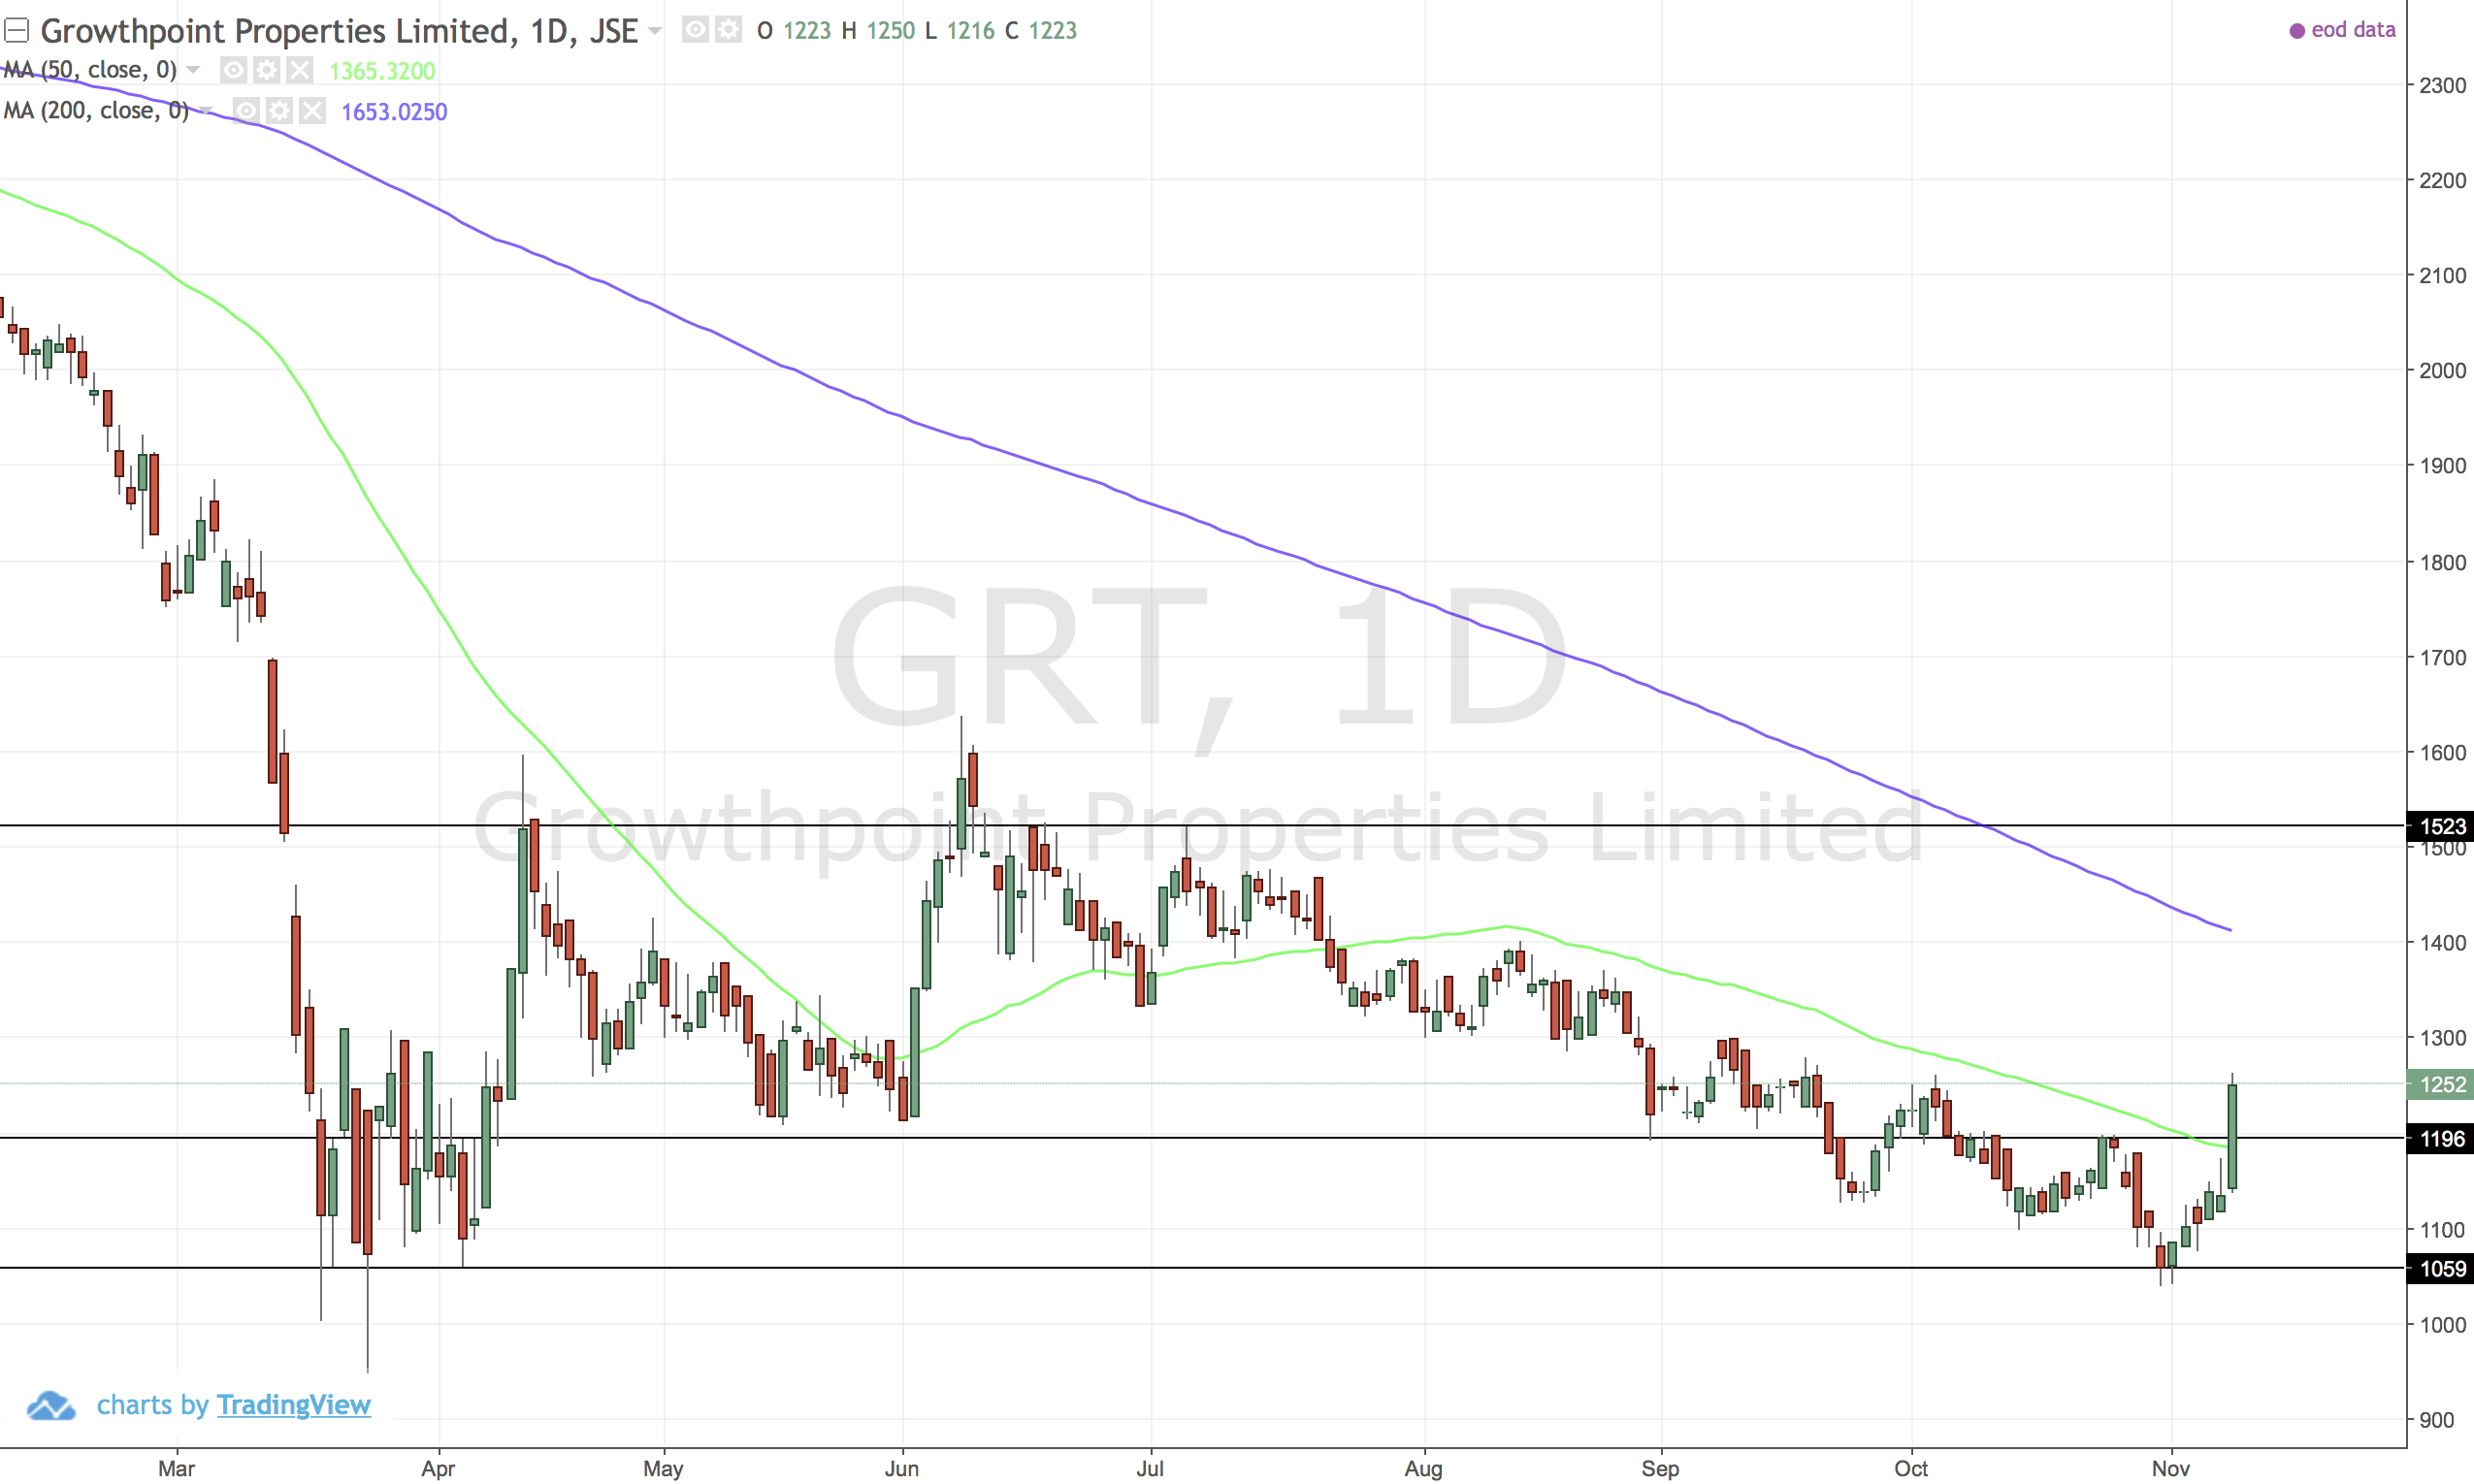
Rebound off 1060, for a higher high. Looking okay but remember the trend is still down.
MSM (Massmart)
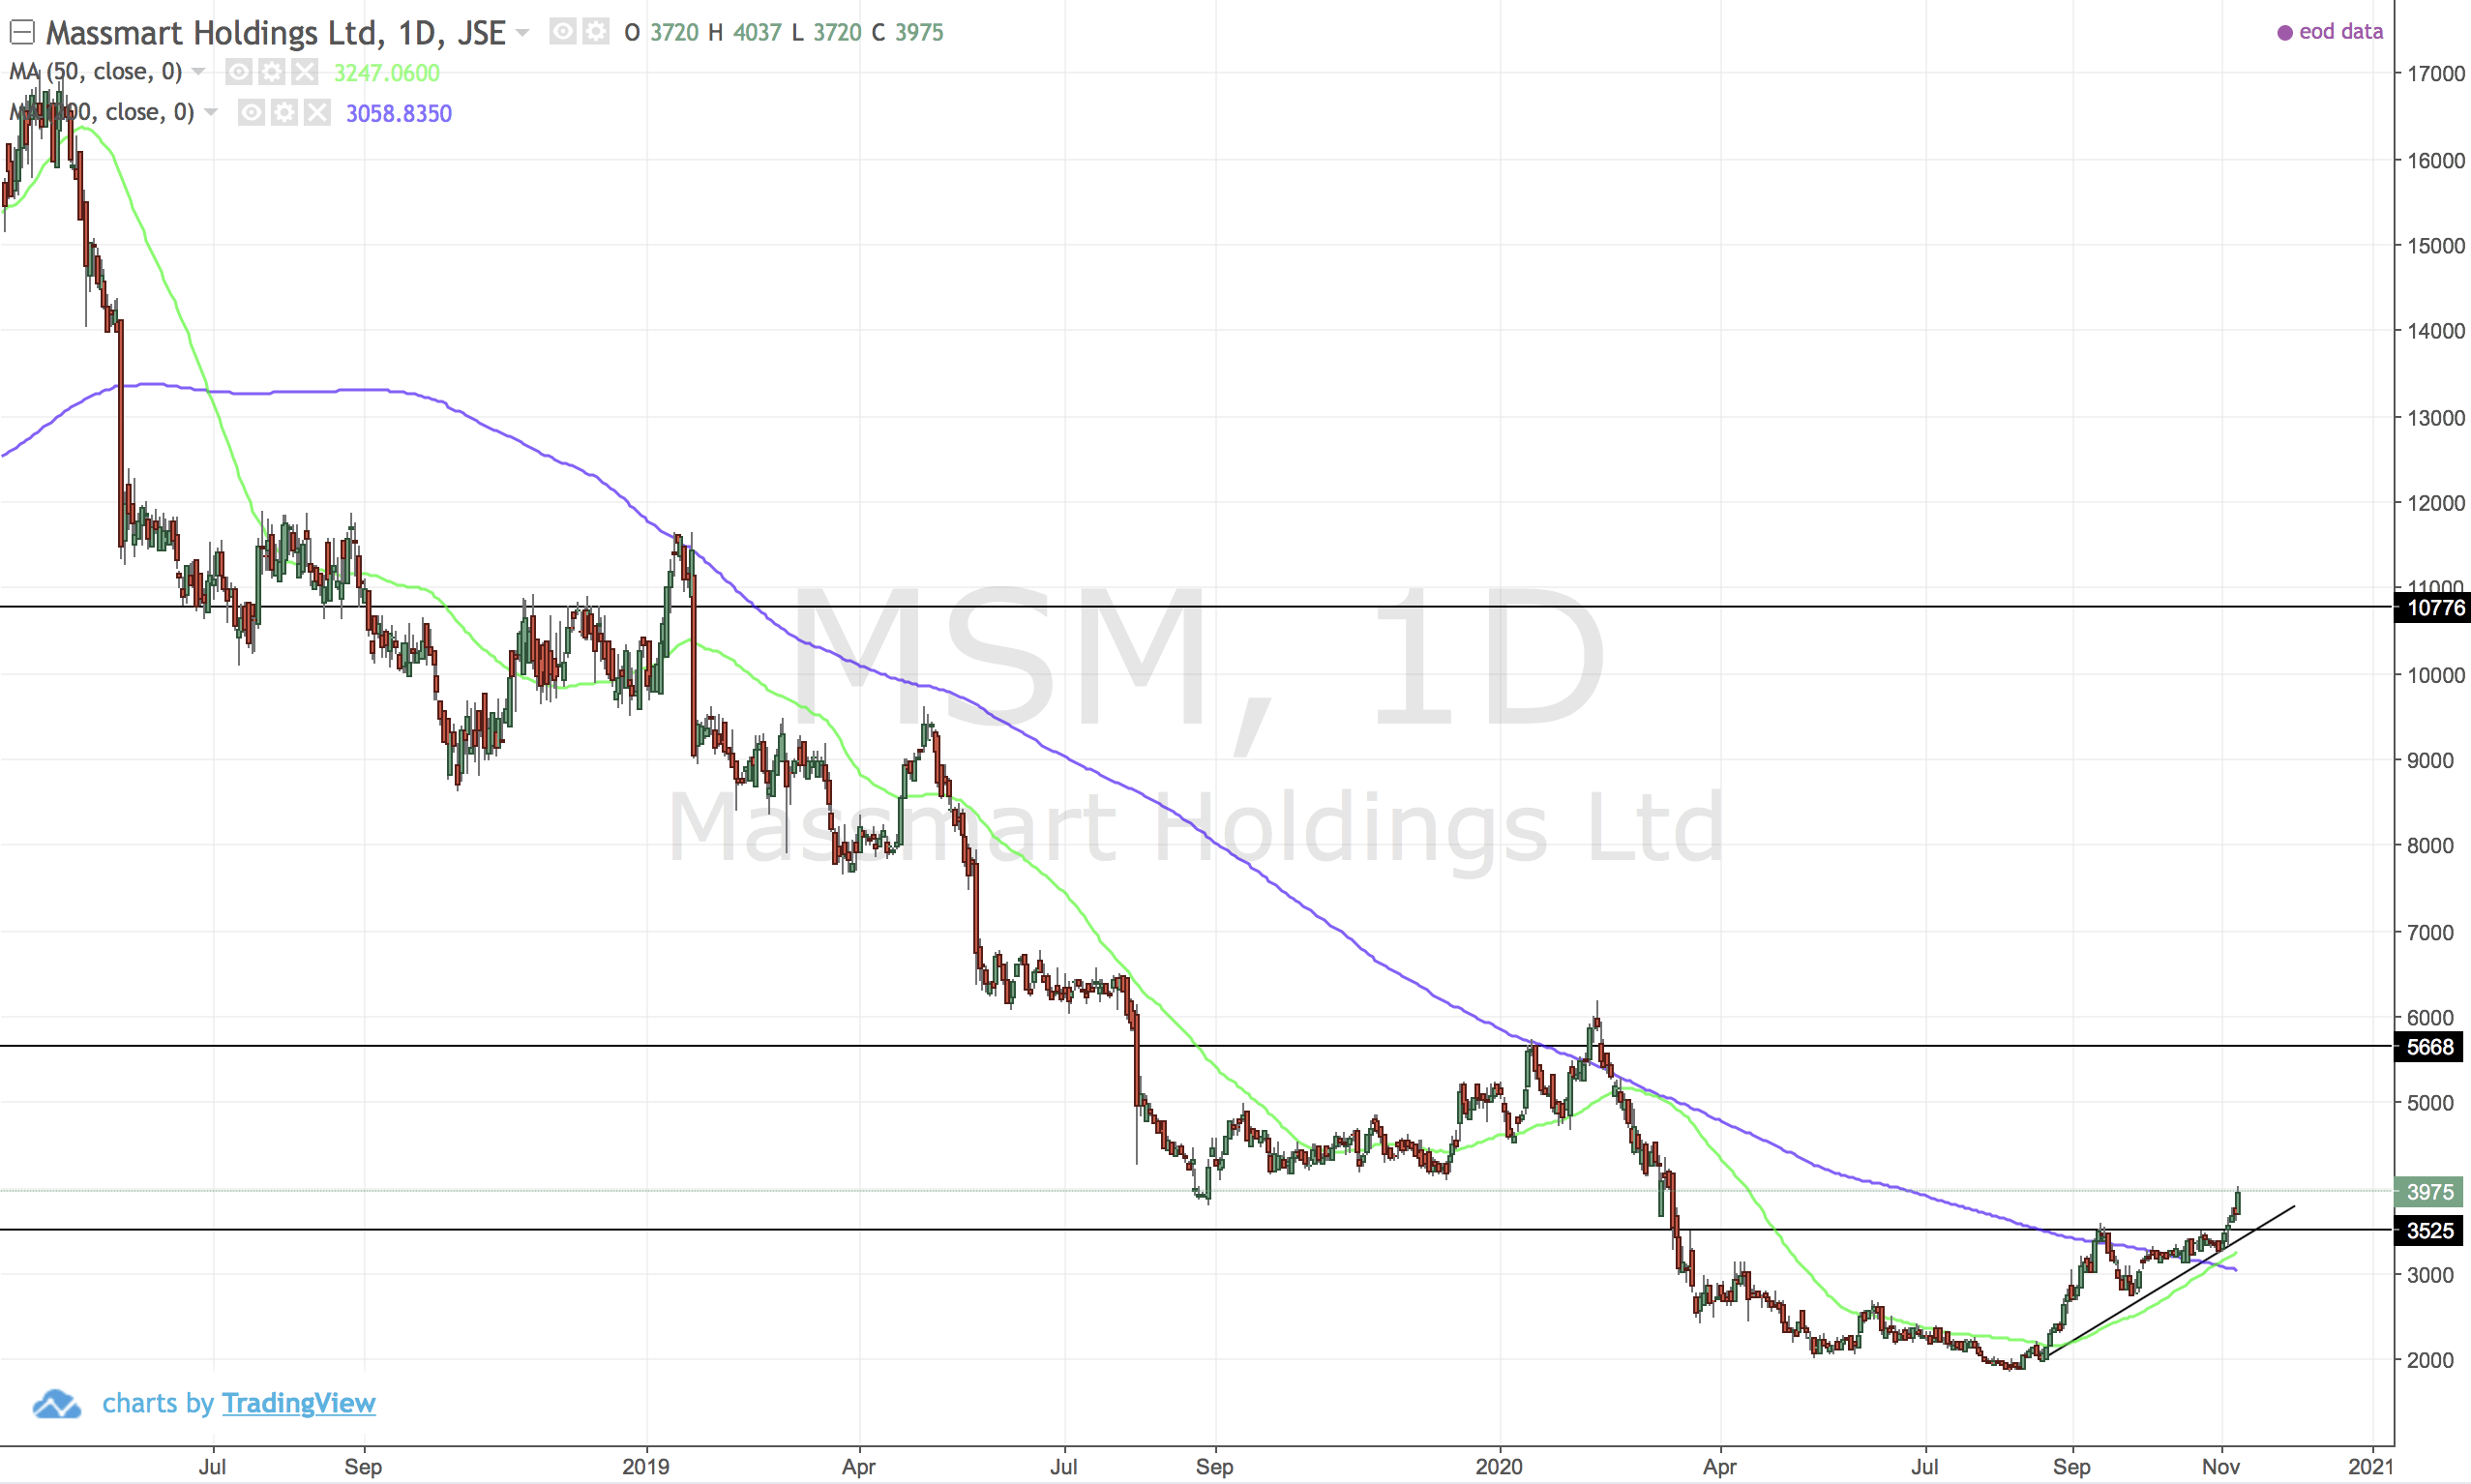
Golden cross. Ascending triangle and cup and handle break. These cup and handle breaks have happened before and burnt many fingers.
I'm cautious however this might be a trend change going on...if it is I want to catch it.
CPI (Capitec)
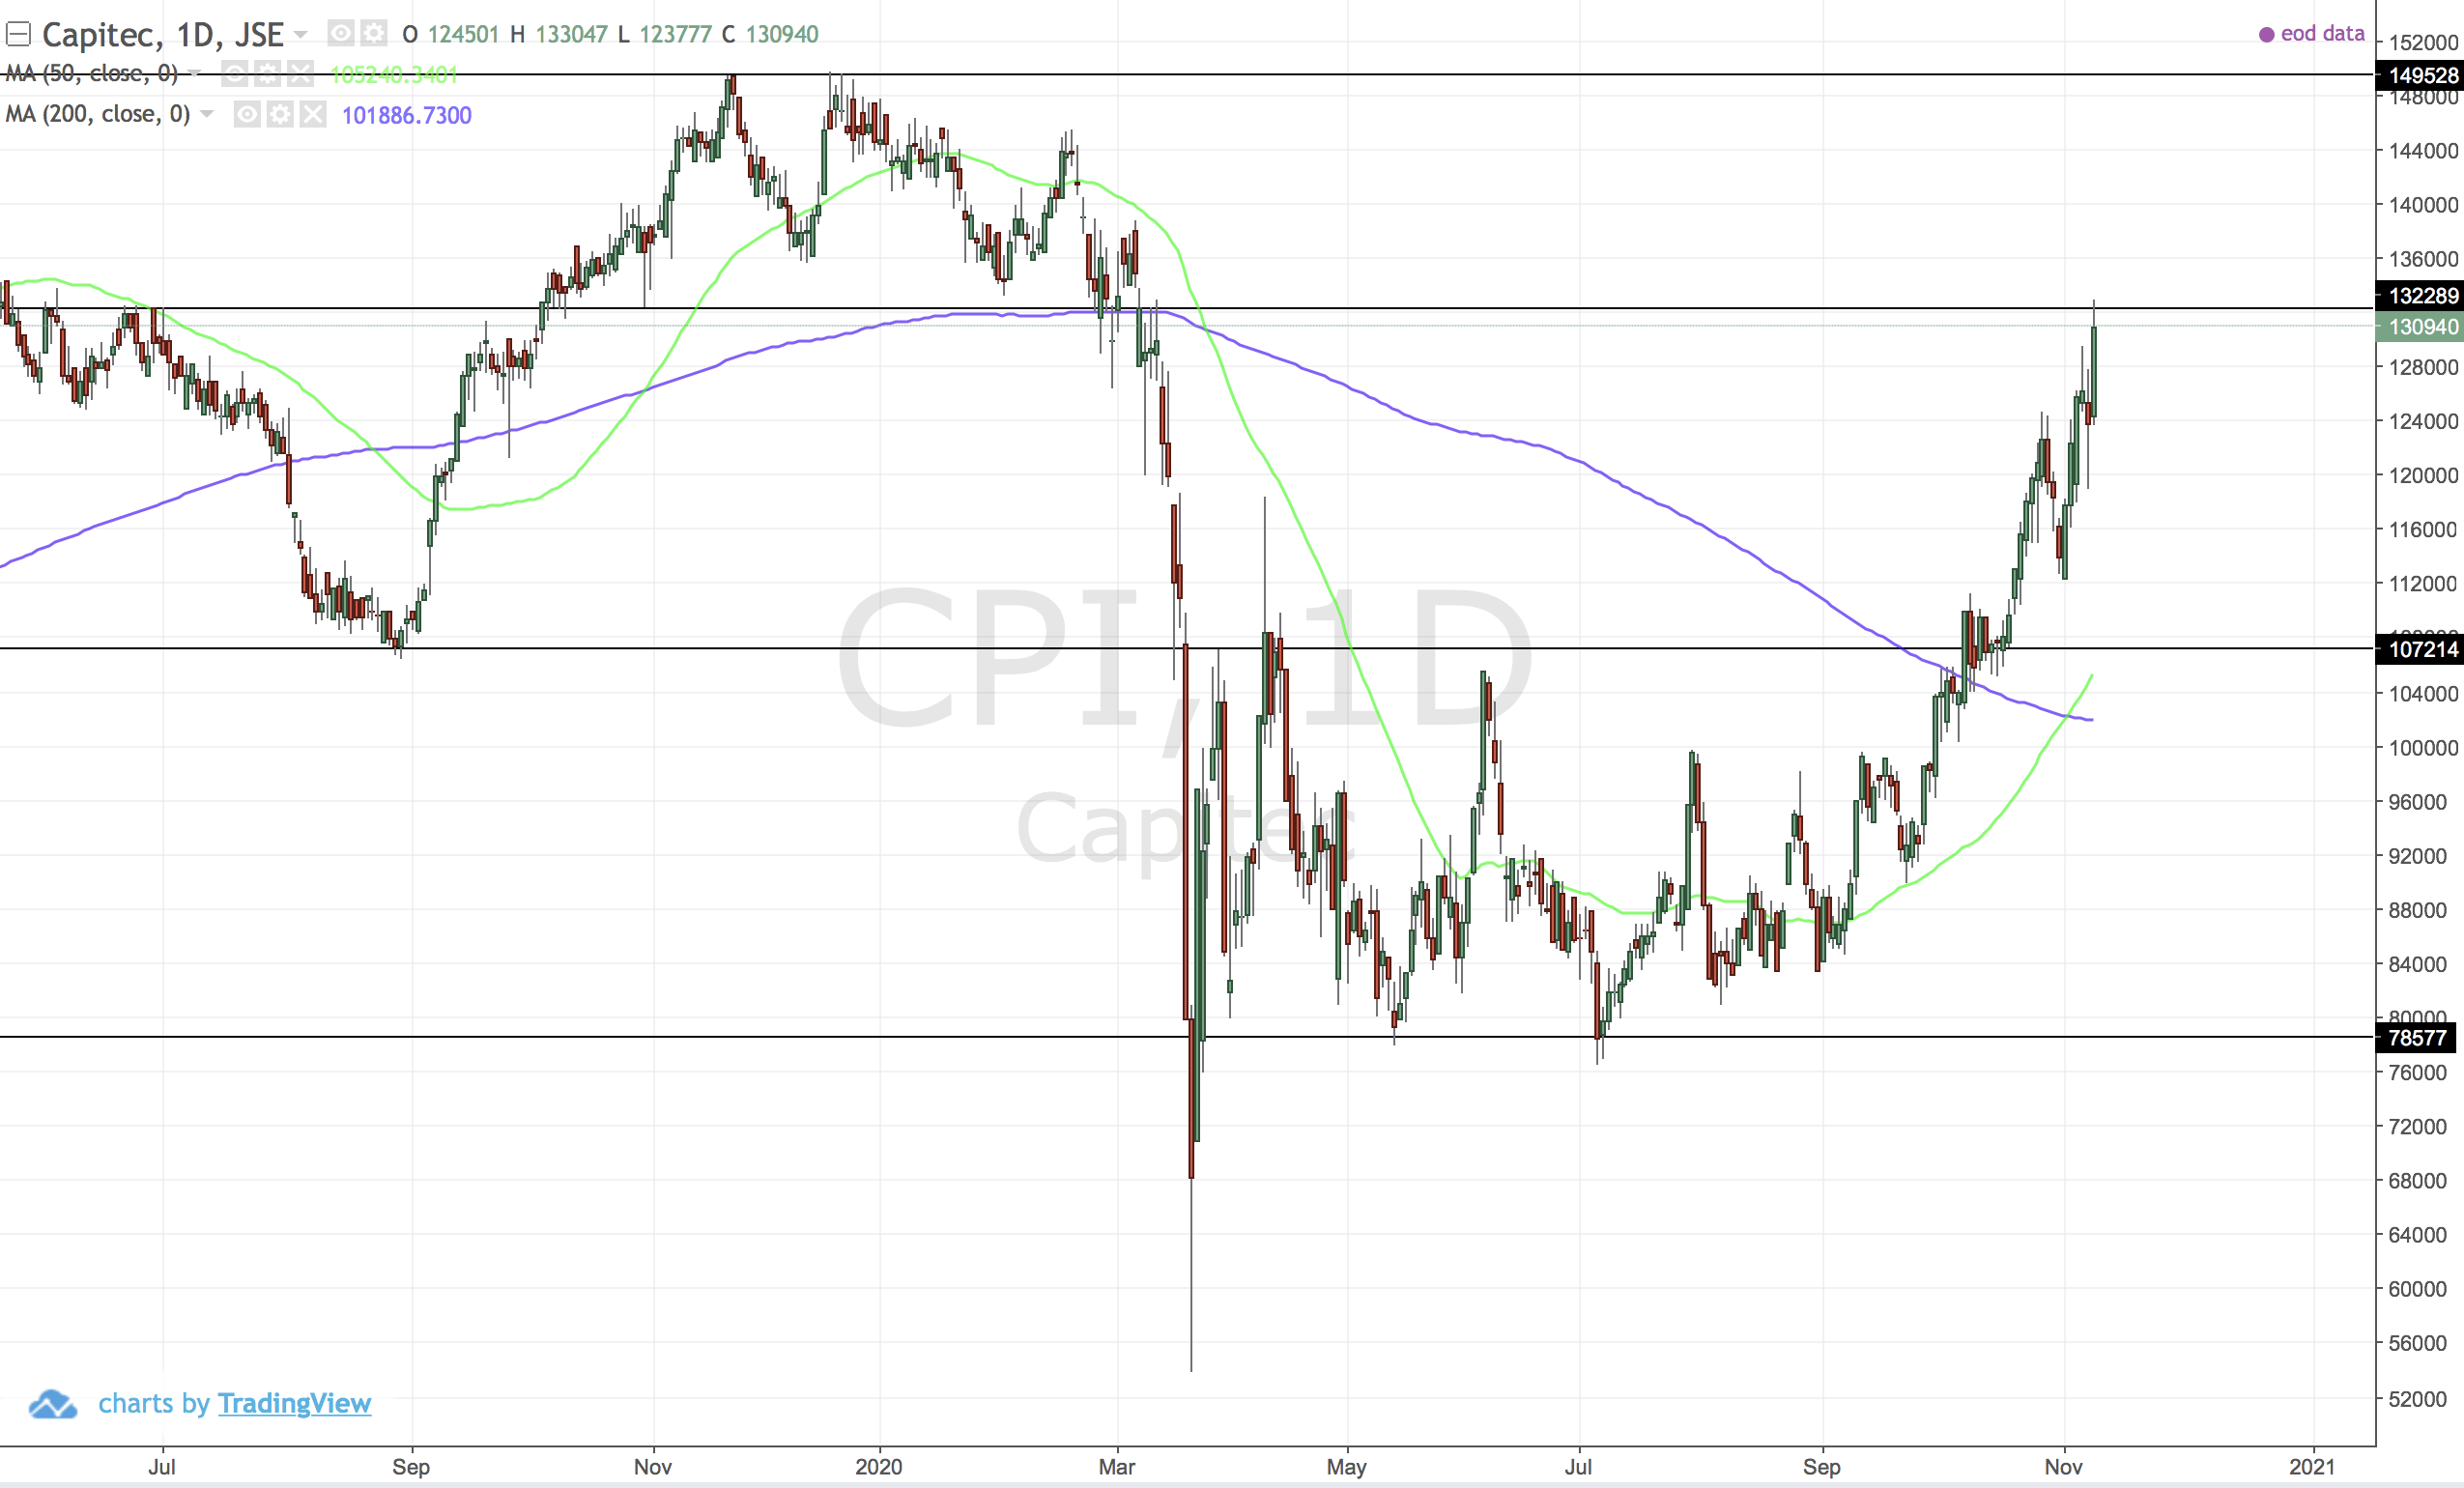
Certainly been a wild ride for hodlers. With the USDZAR strength perhaps new highs are achievable. Not one for me though.
OMU (Old Mutual)
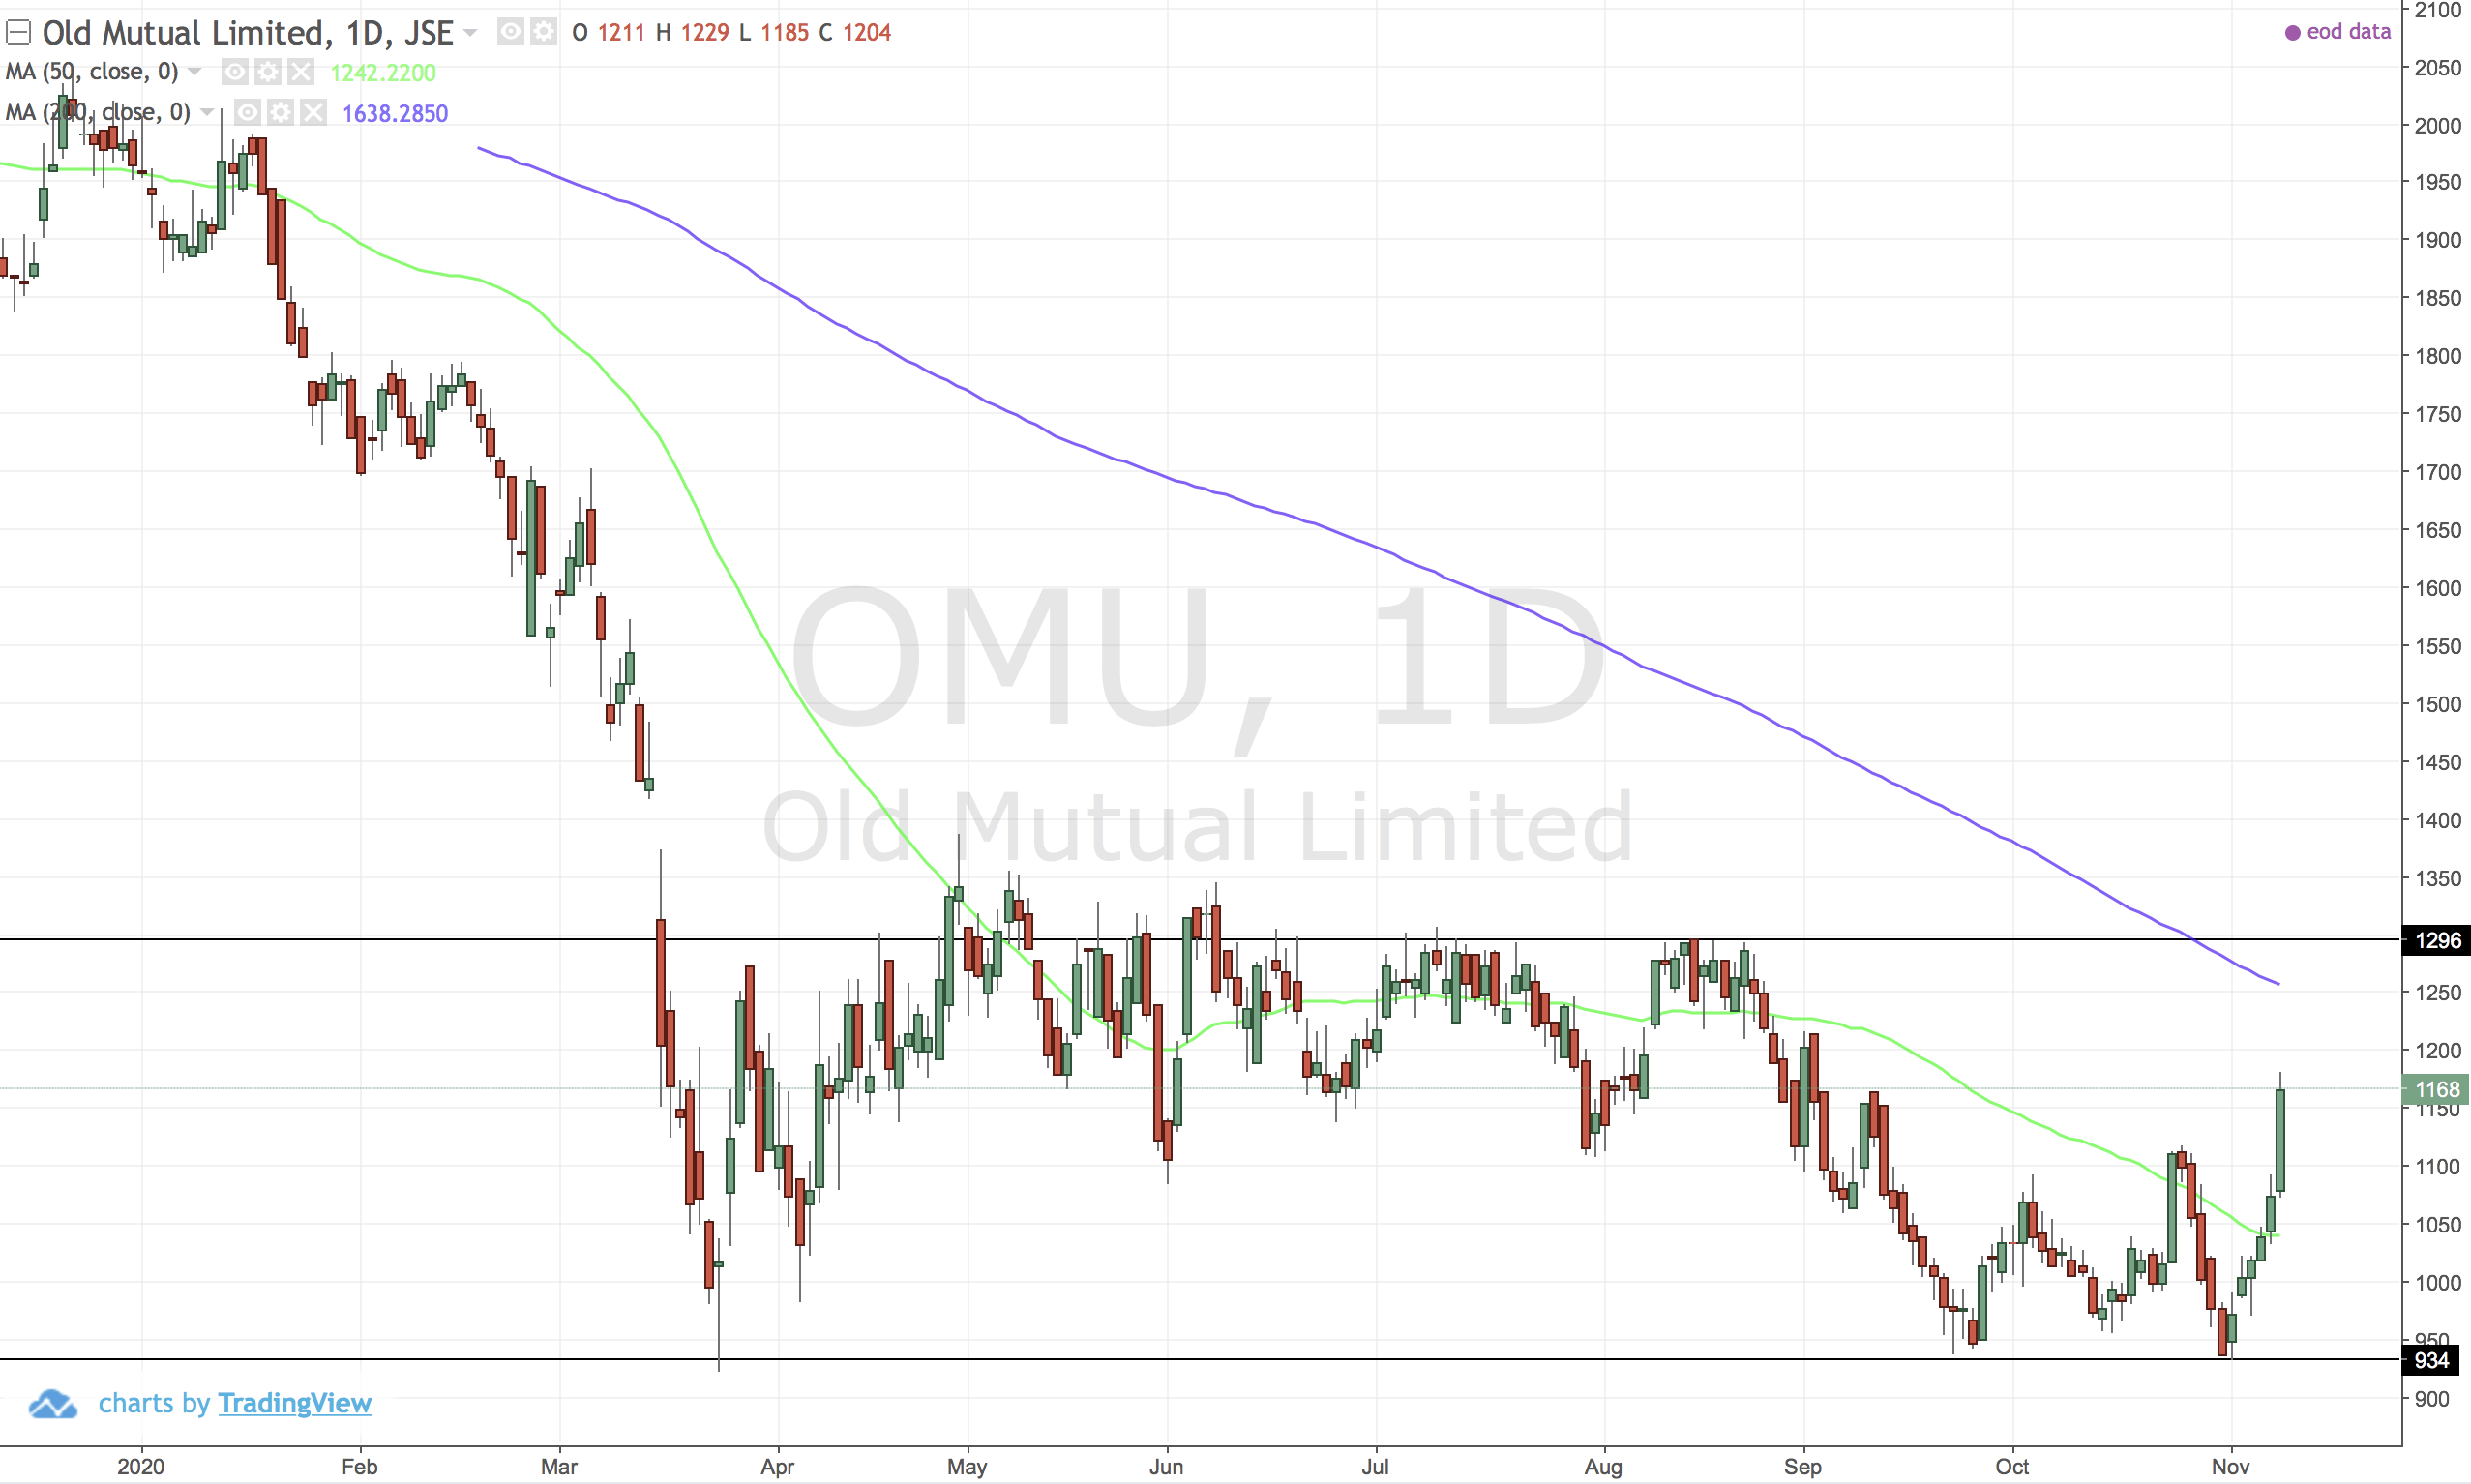
Needs a move above 1300 to show some real strength.
DGH (Distell)
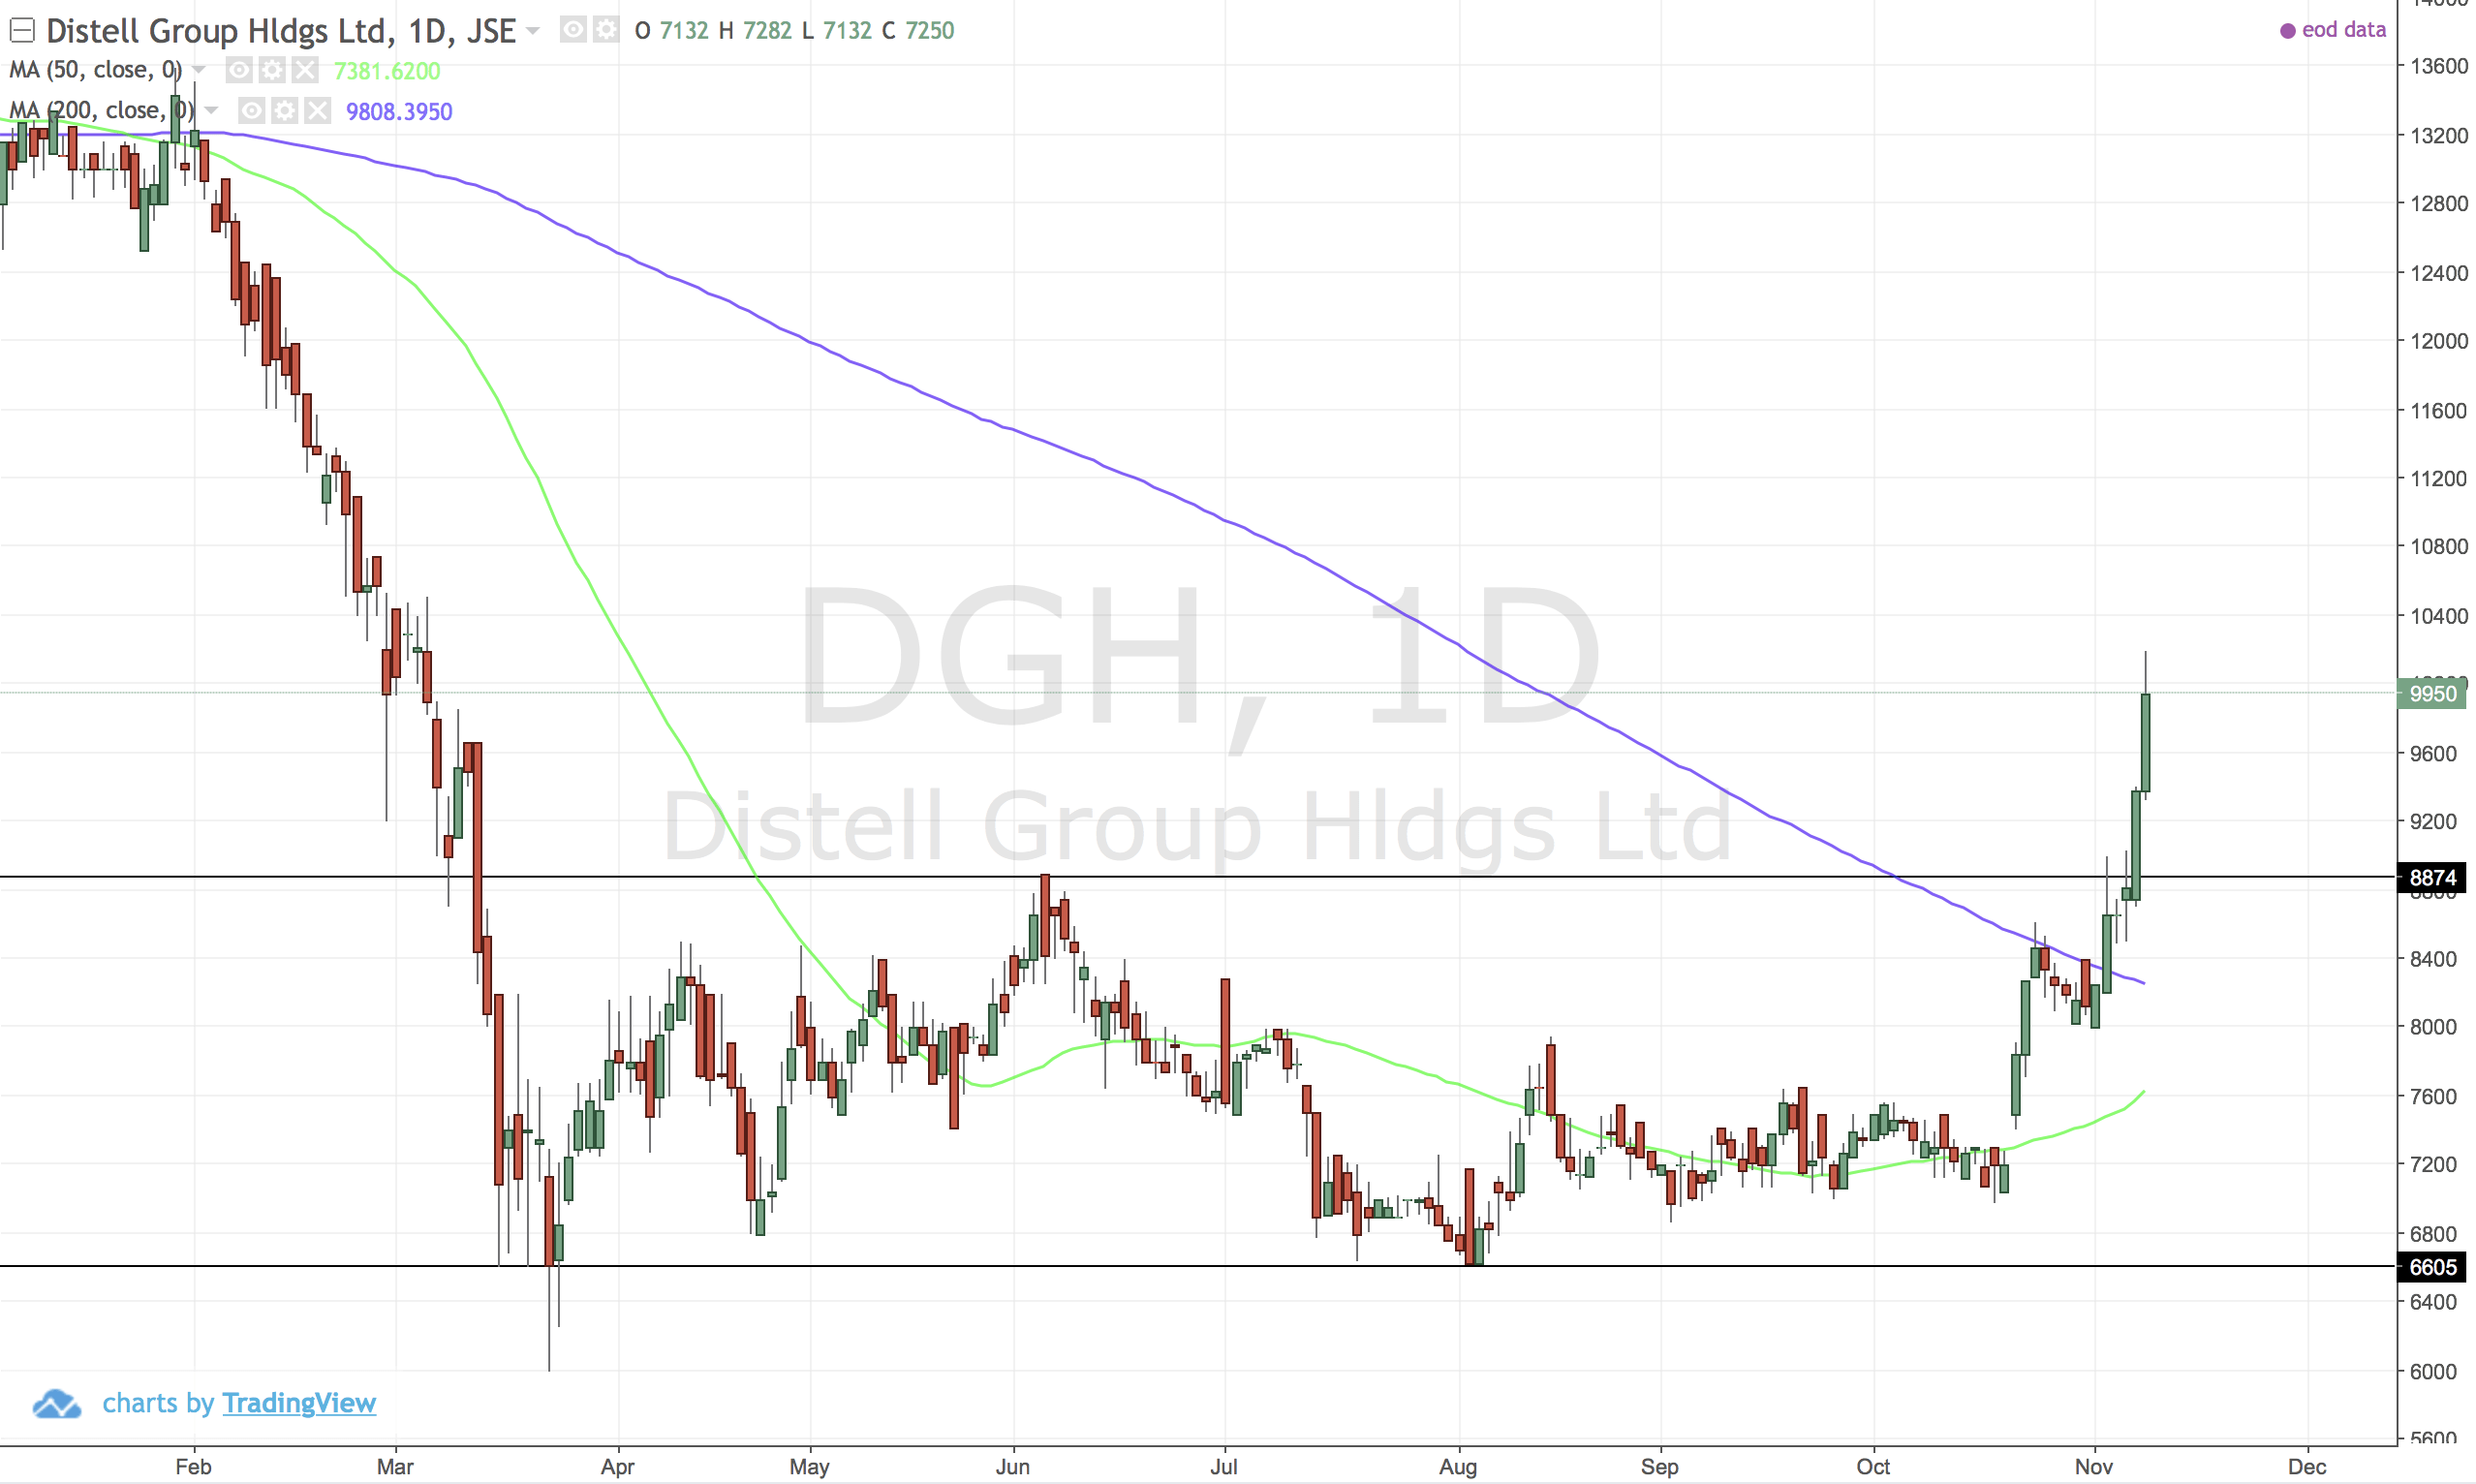
Big moves lately but no clear trend that says stable growth is coming.
GFI (Goldfields)
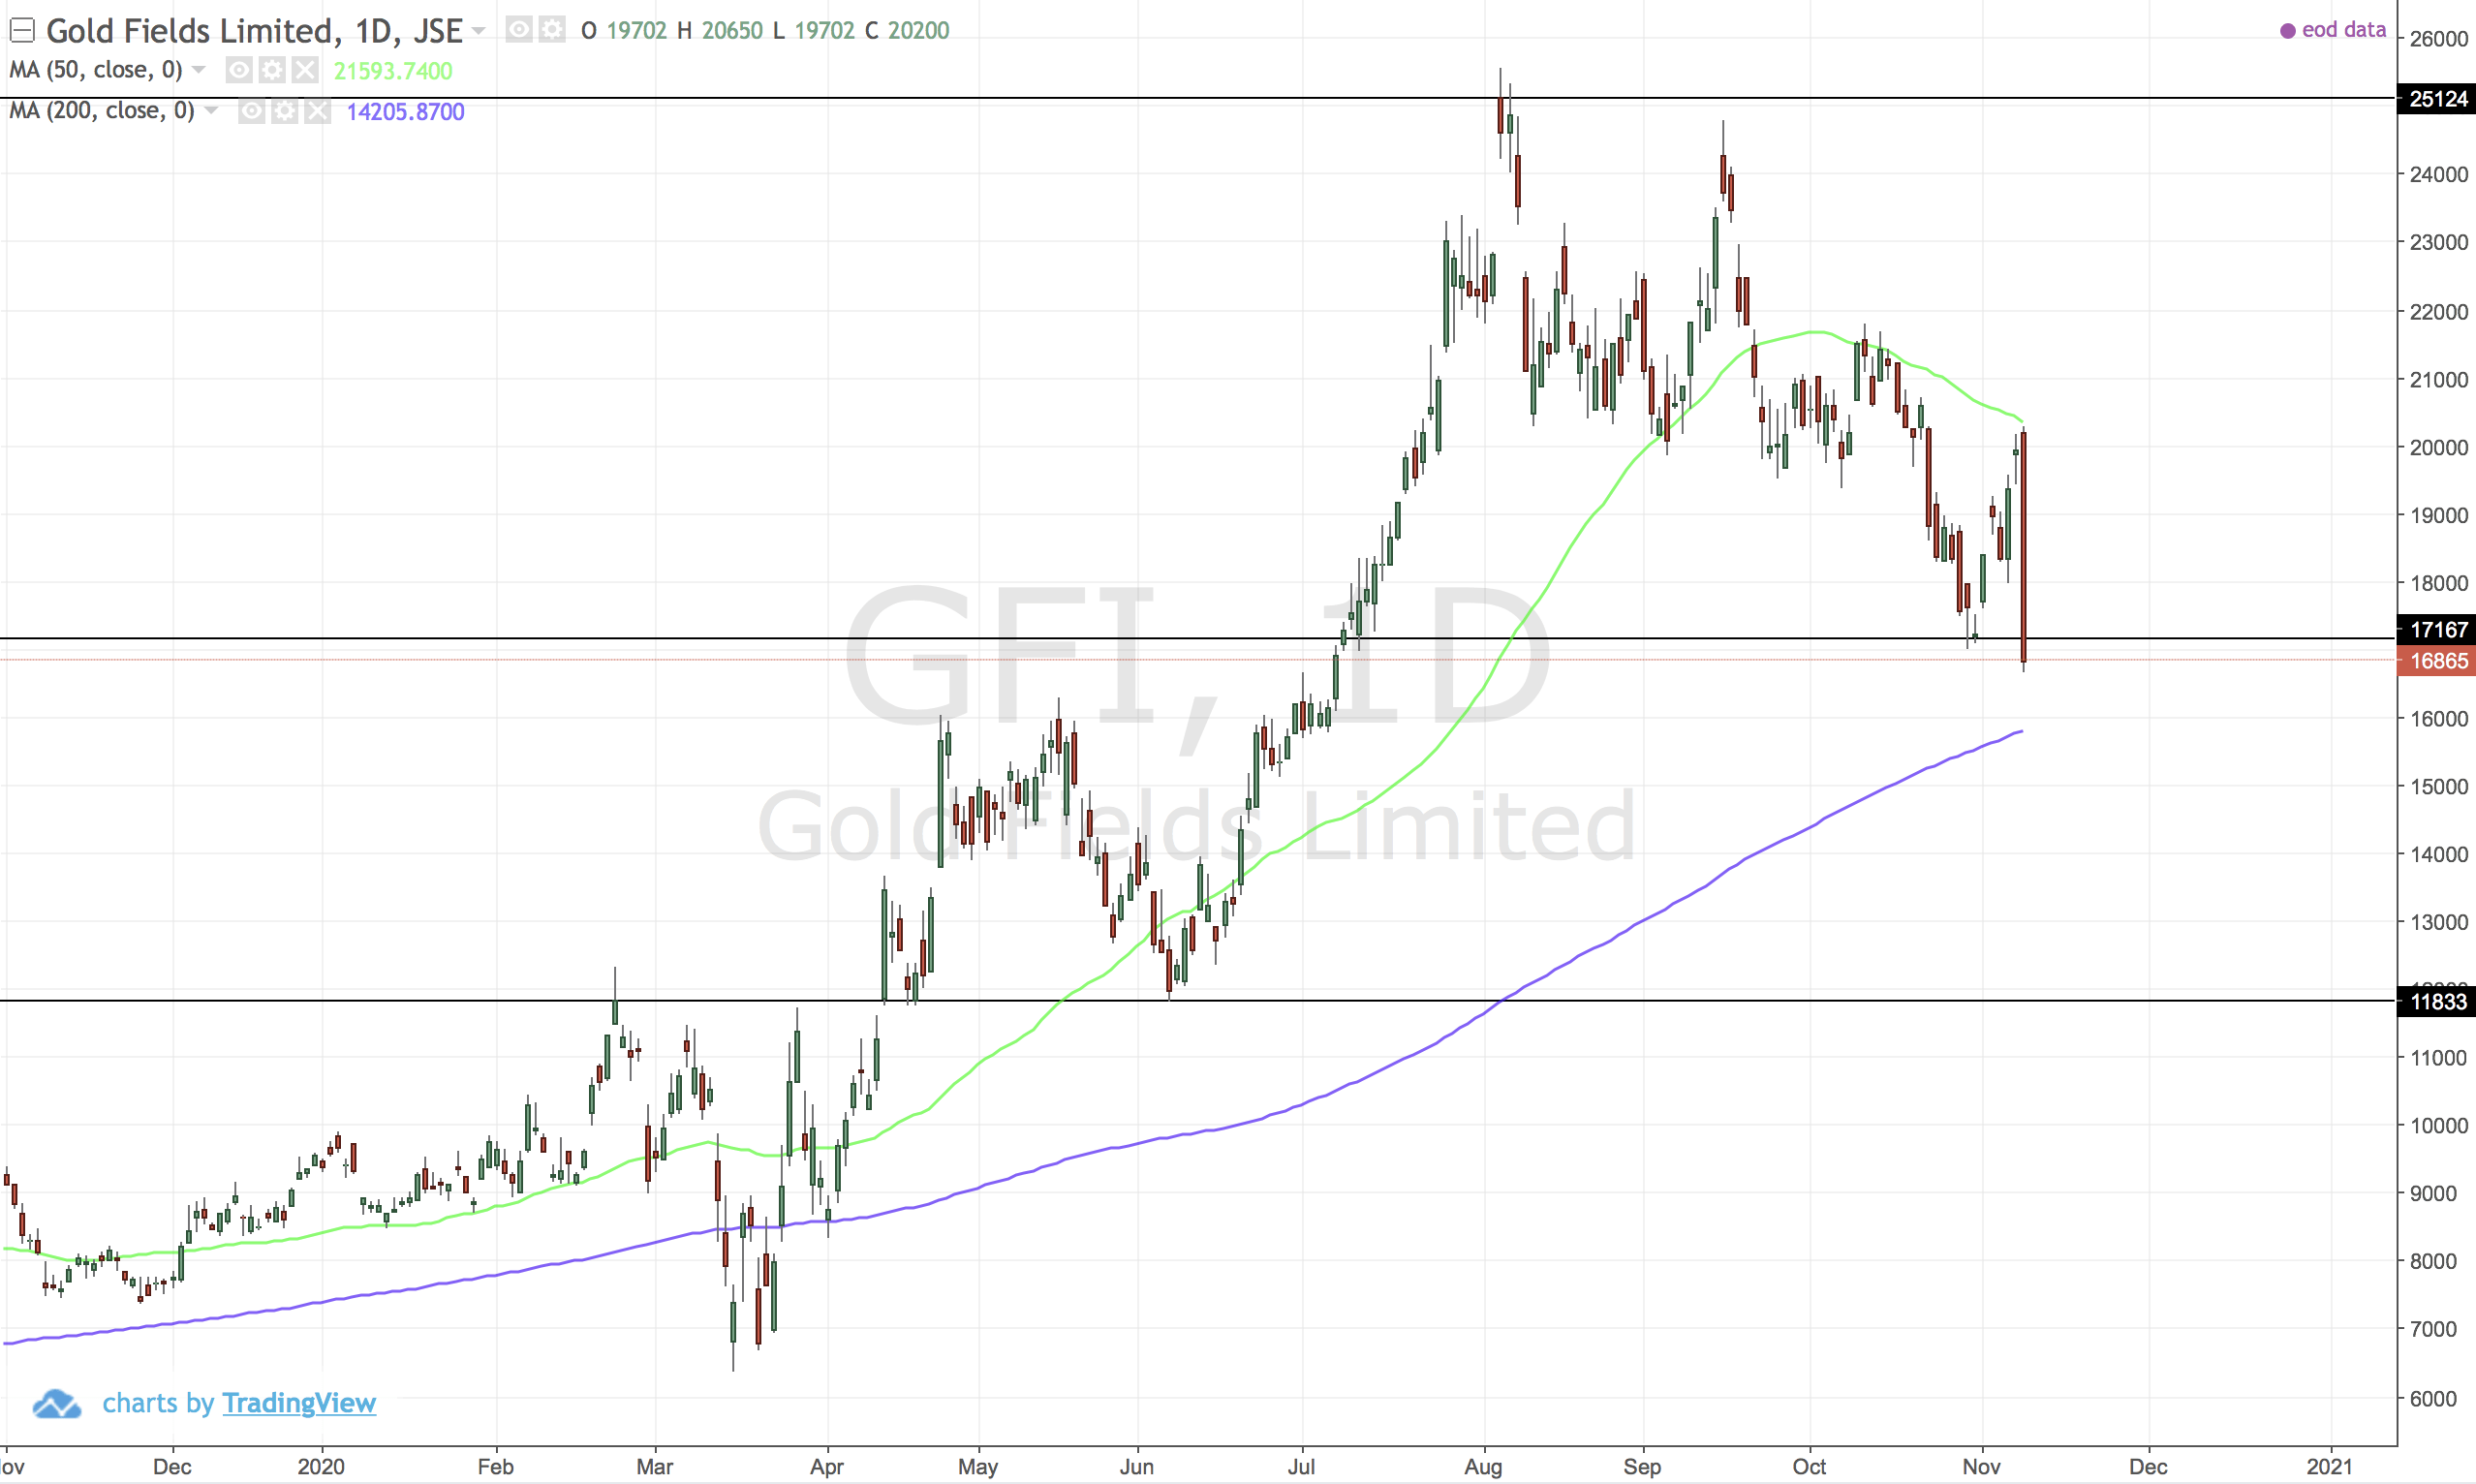
Big drop yesterday more than 15%. Inverse cup and handle pattern is formed. Long term trend is still strongly up however not medium term. The USDZAR and XAUUSD / GC situation has affected the stock. I need to make a decision now - trading psychology coming into play.
SSW (Sibanye-Stillwater)
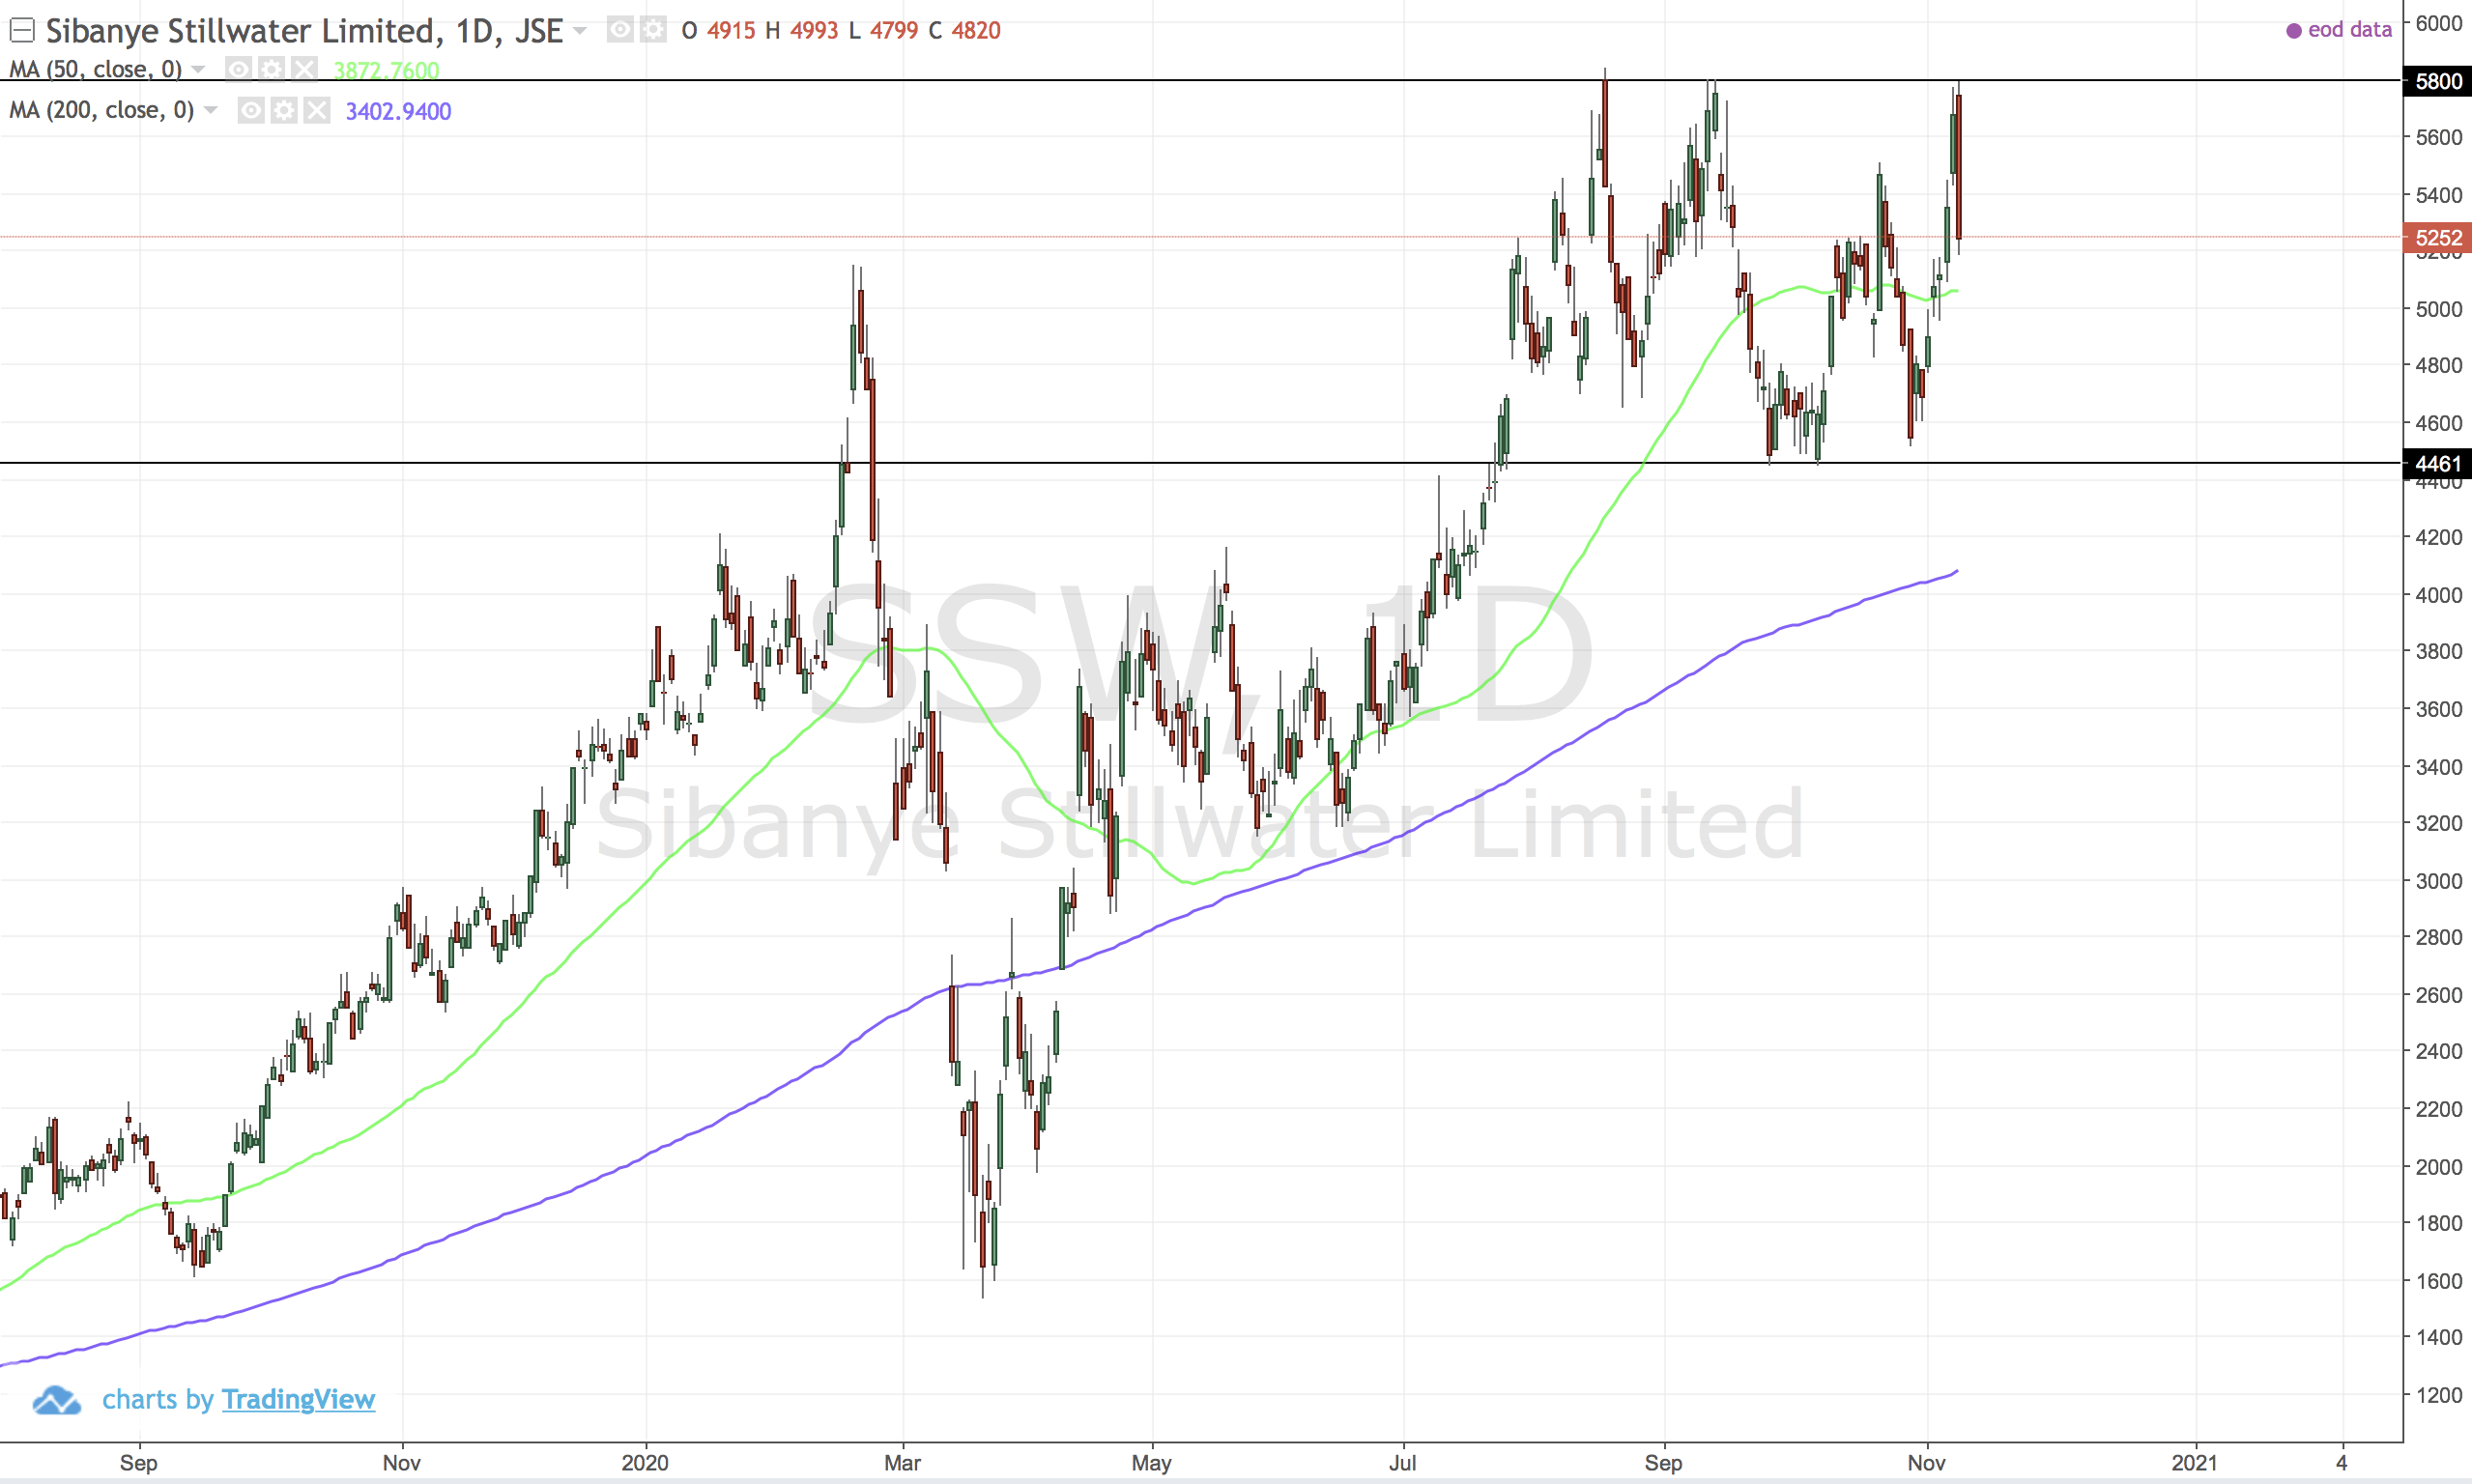
Strong resistance ahead but does not look bad at all. Palladium price is perhaps softening the blow compared to other local gold stocks.
Still ok, I'm holding.
PPH (Pepkor)
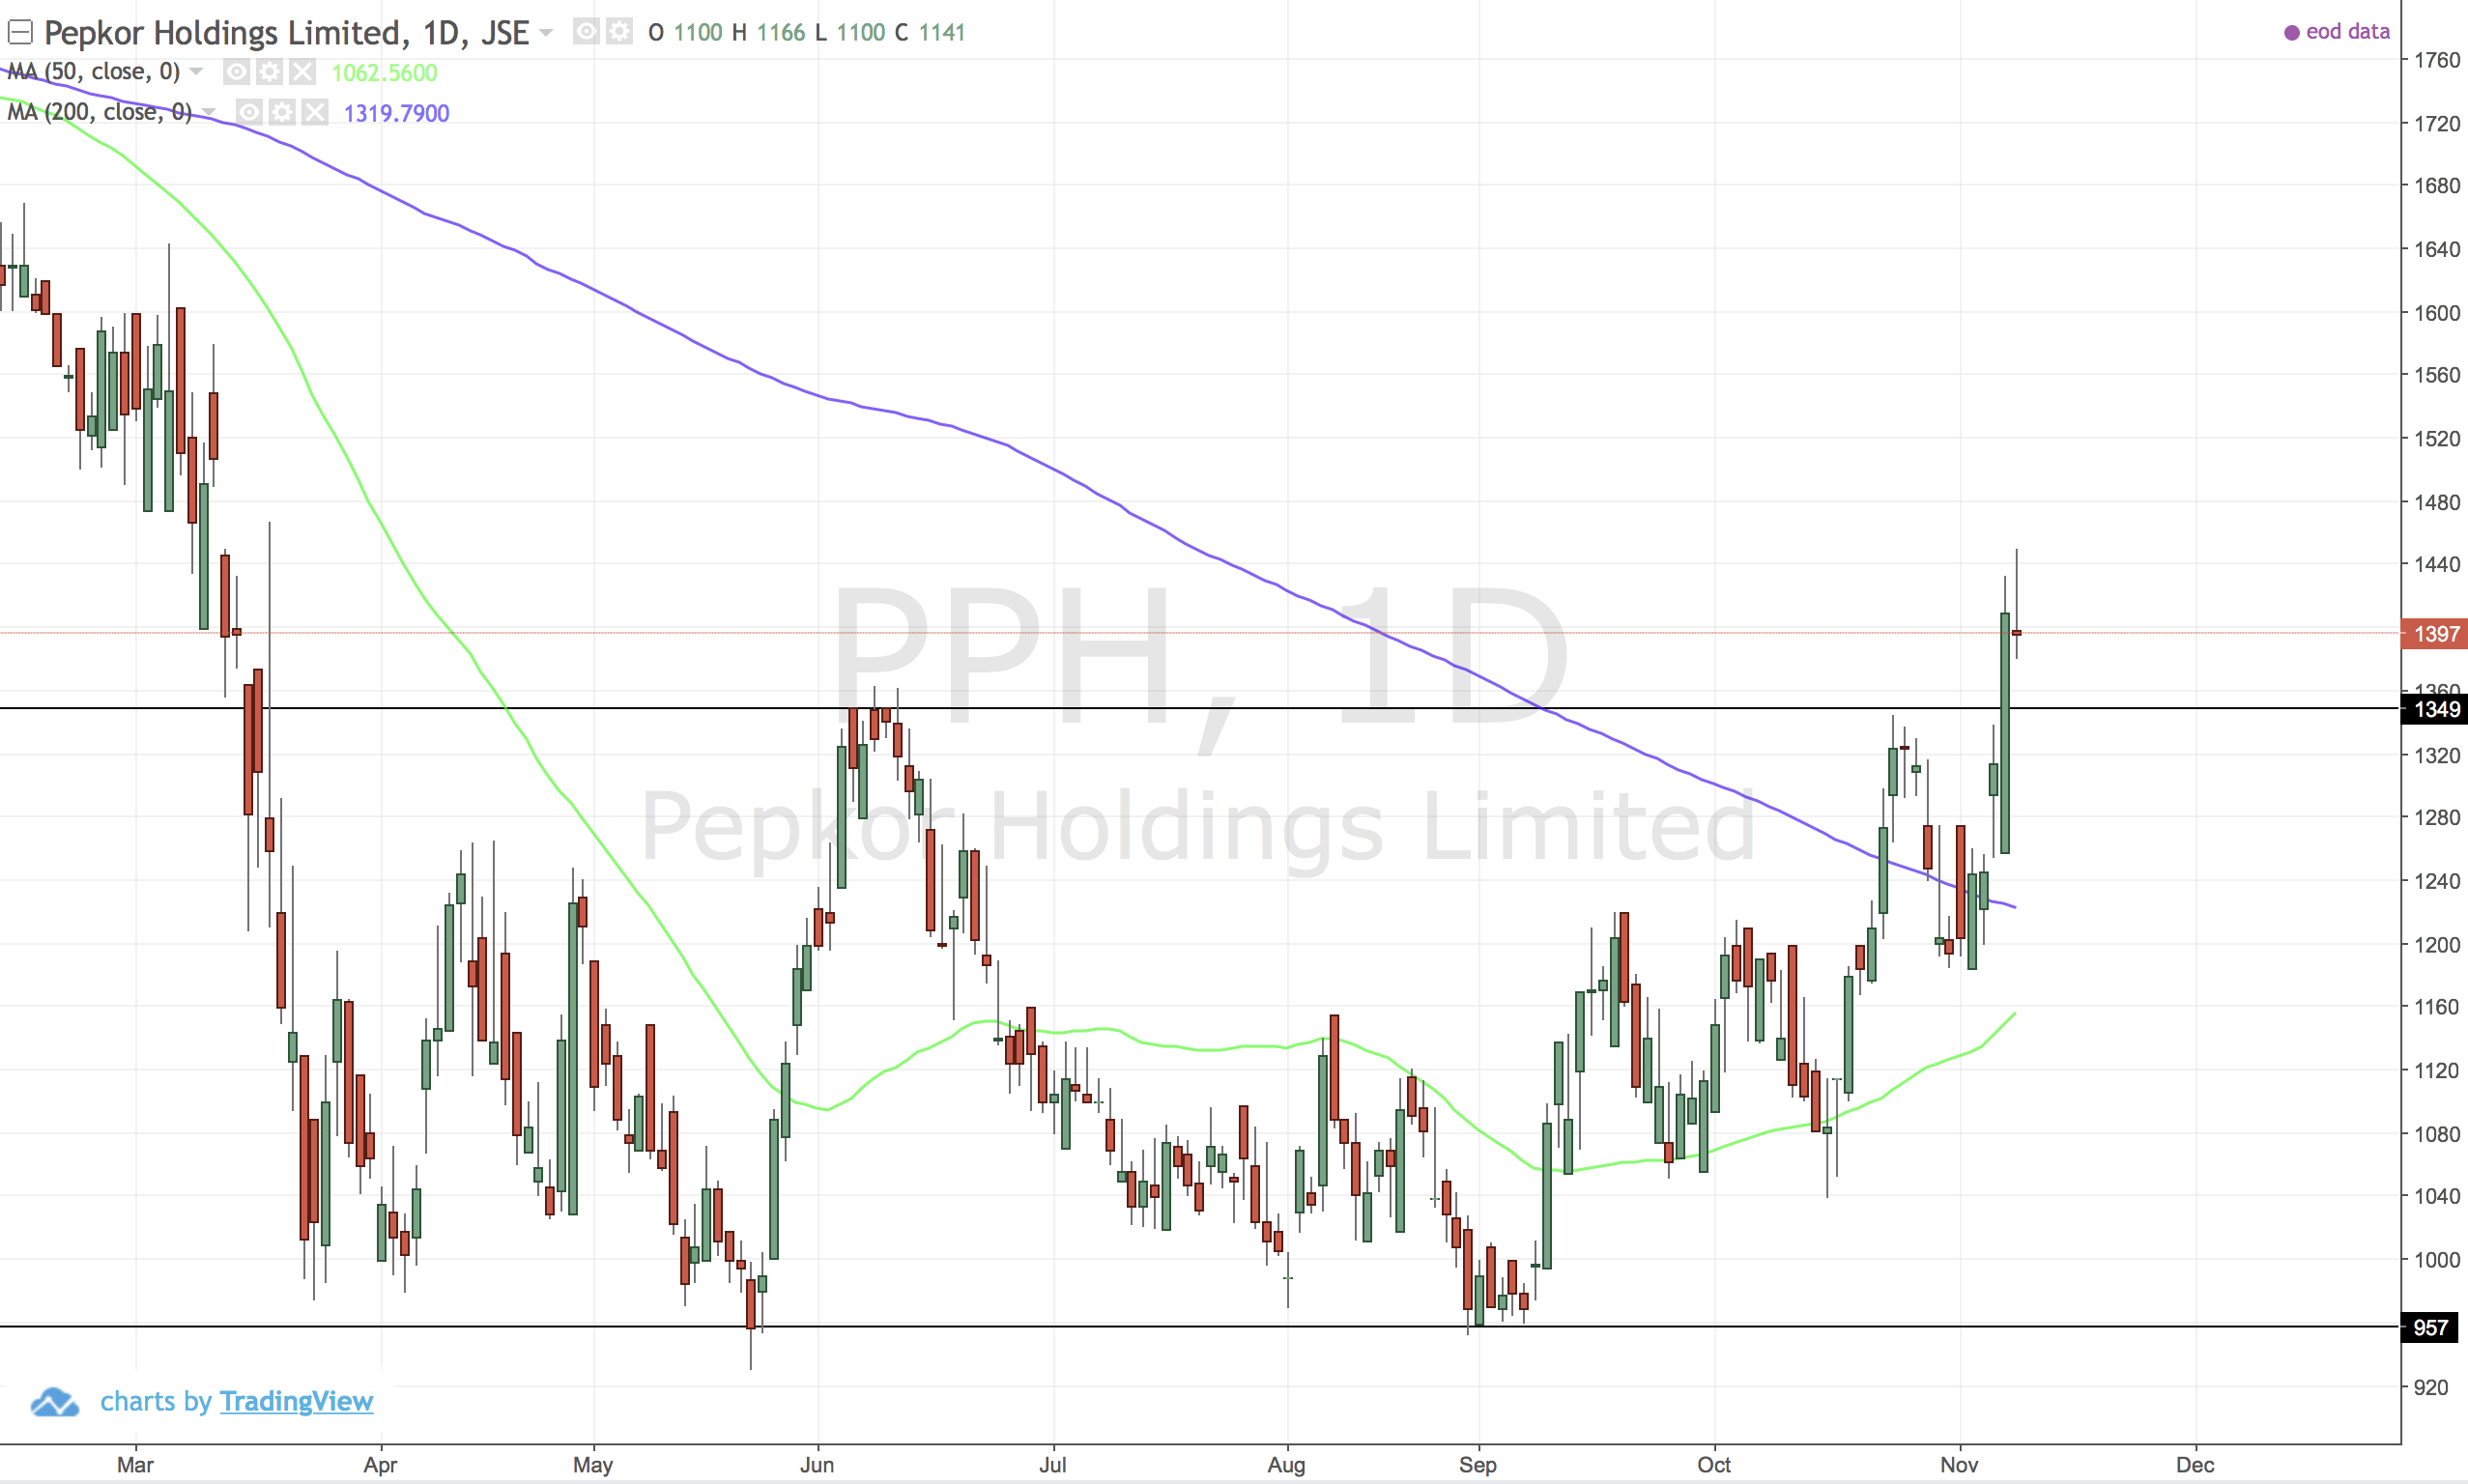
A breakout from the big double bottom. Series of higher highs and lows. Looks good, but I'm not feeling it.
PRX (Prosus)
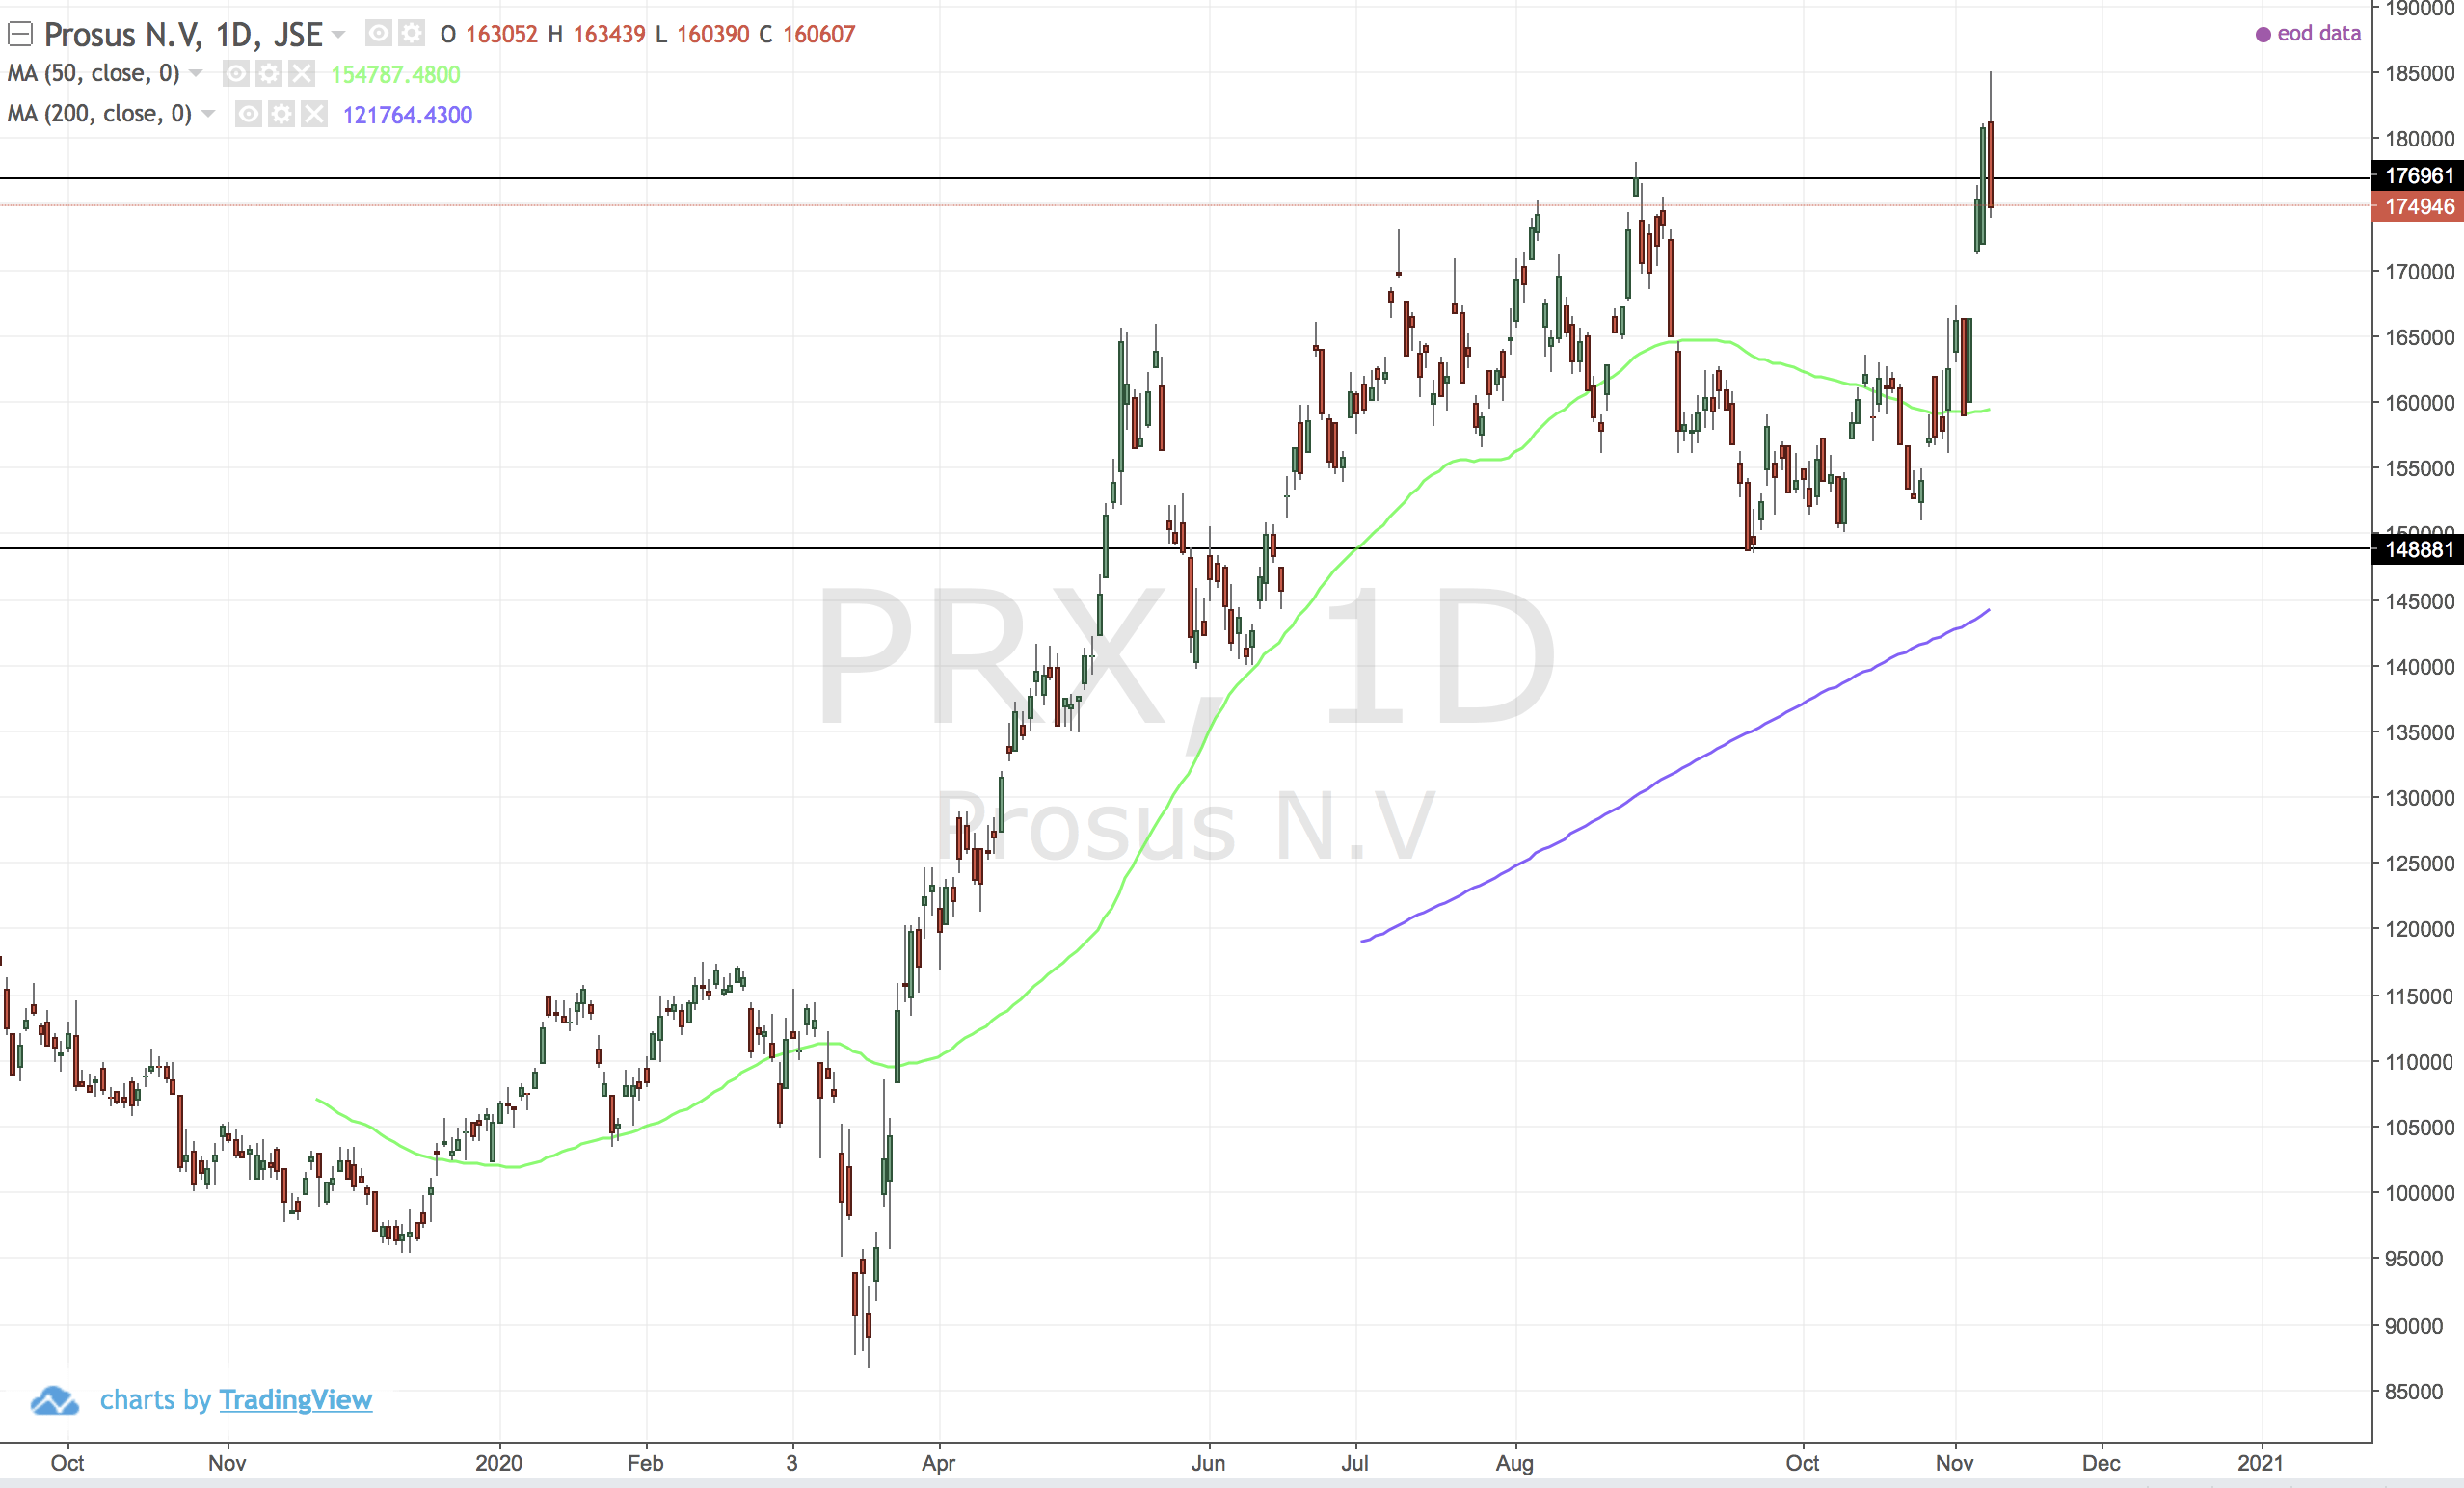
Breakout and then break back around the 177k resistance. Trending up alright - maybe worth a punt.
US:ZNGA (Zynga)
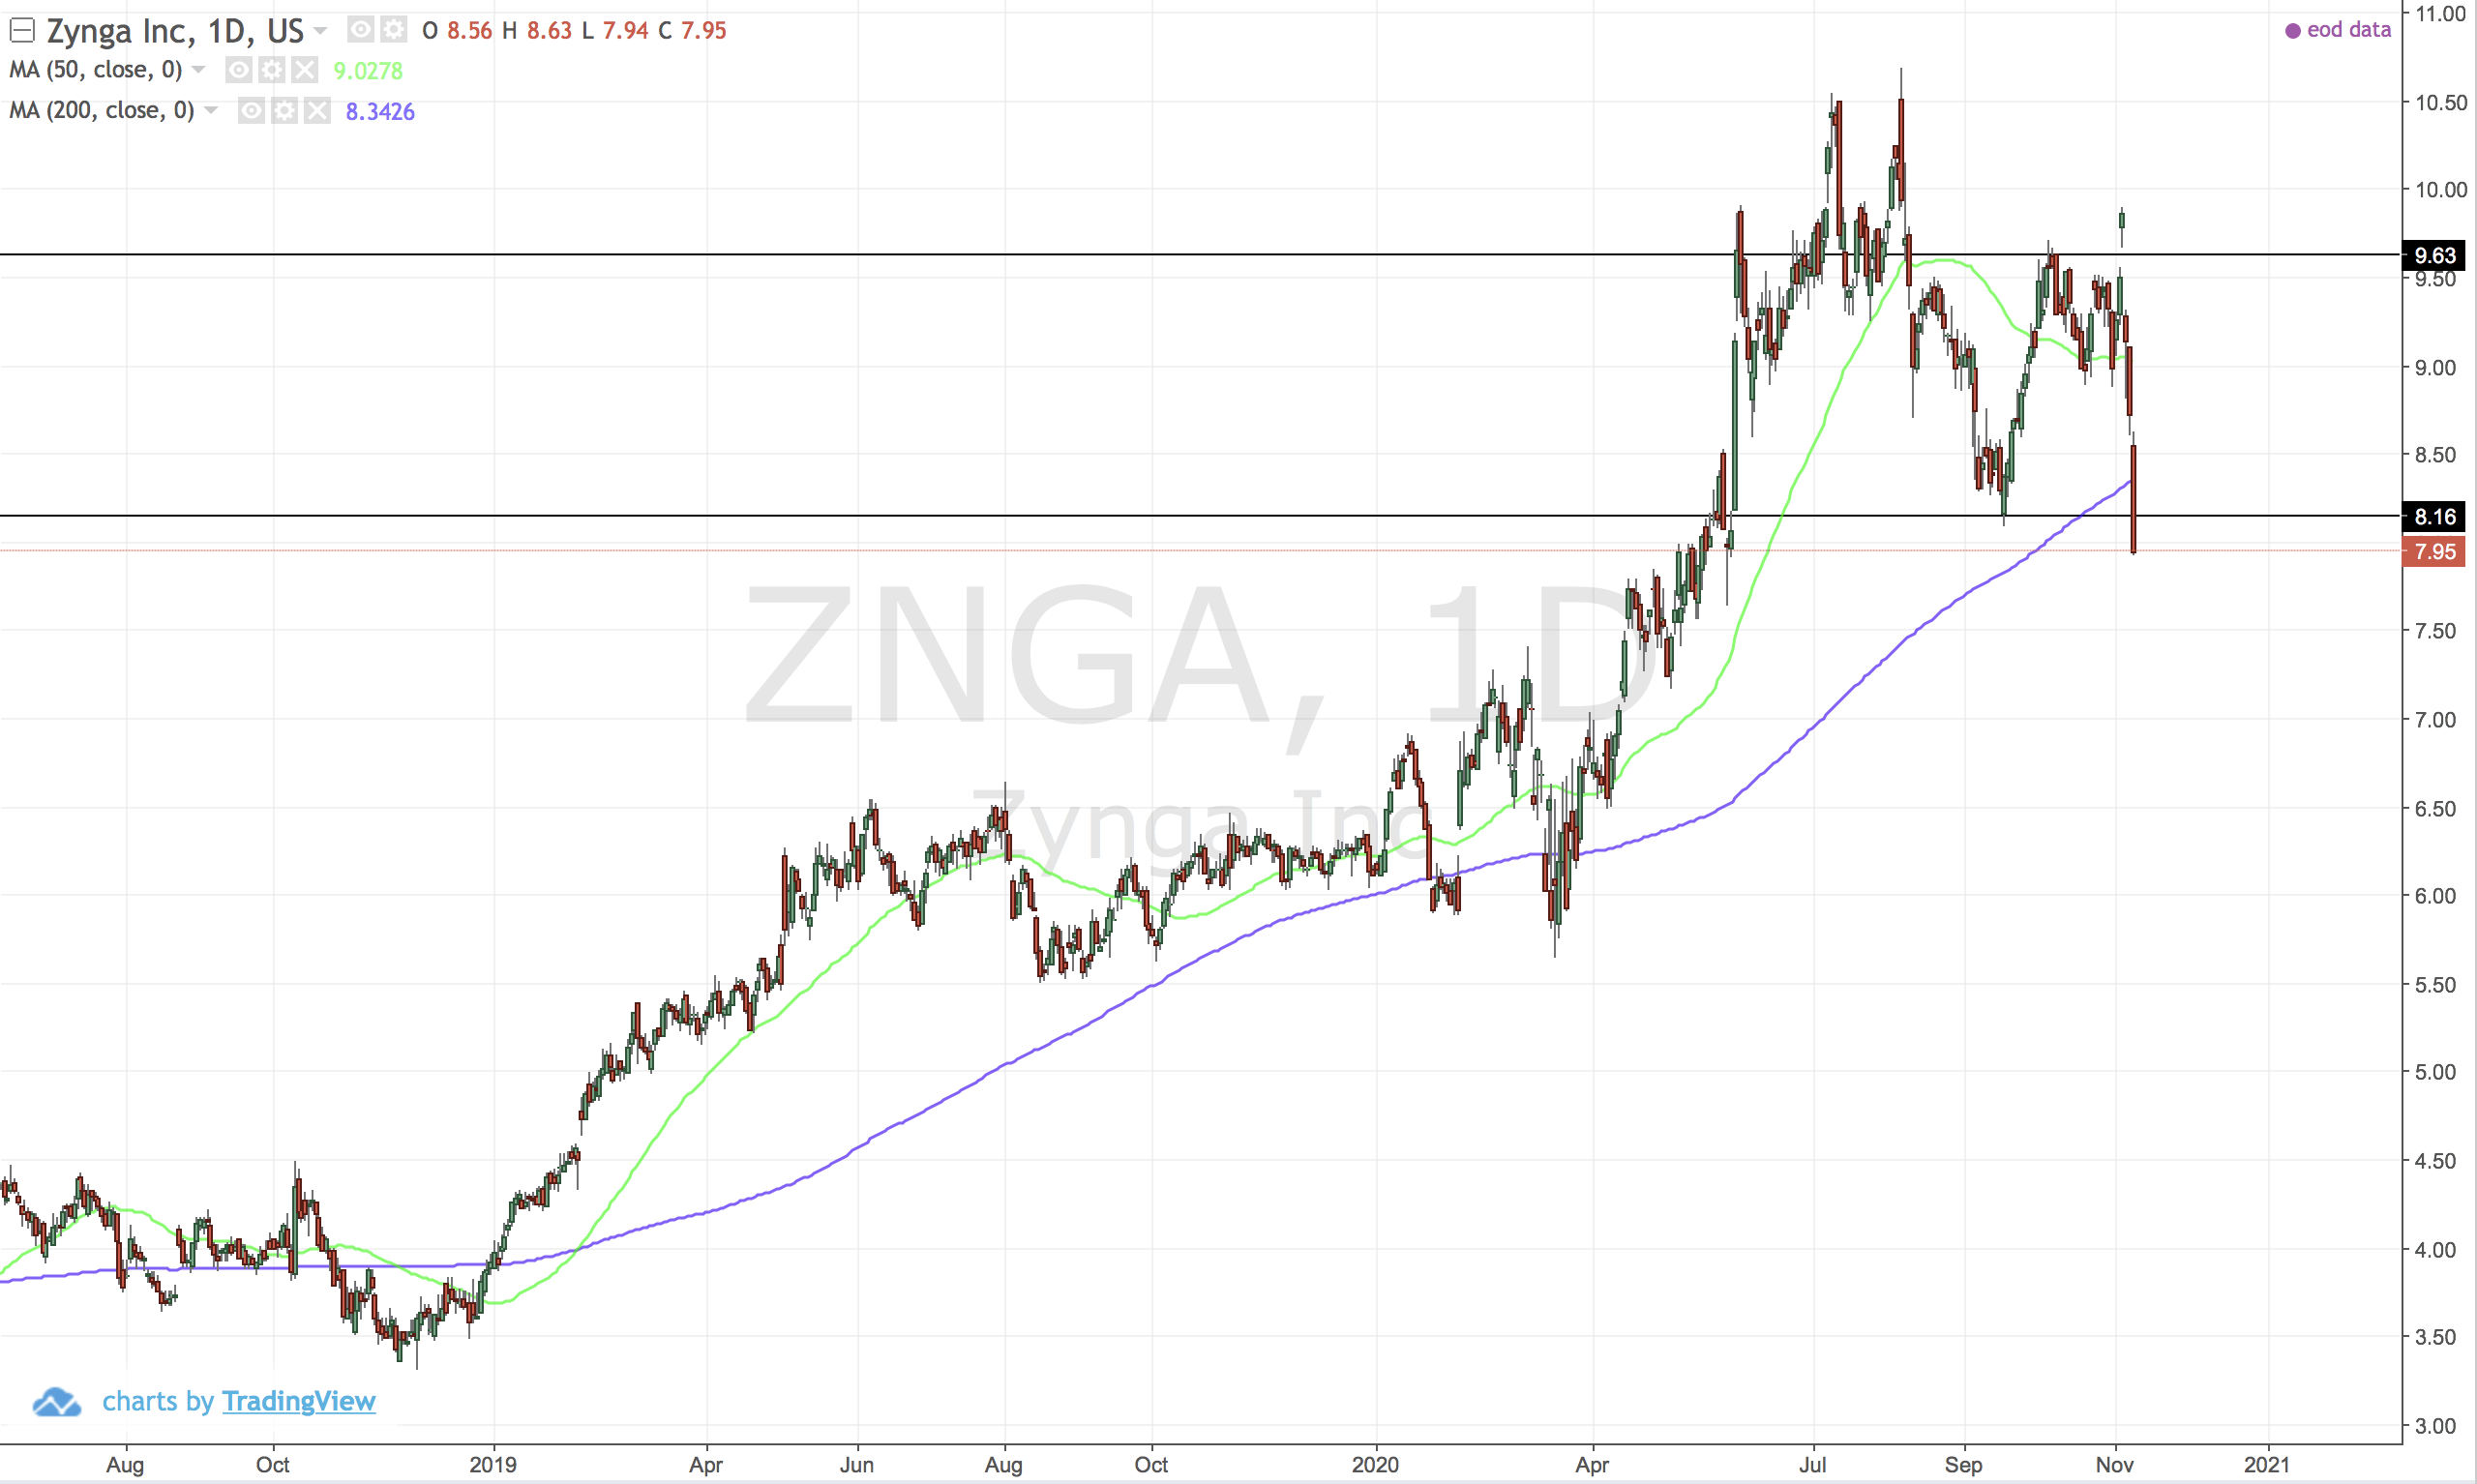
Cracked. That does not look good at all. Goldfields chart above looks better.
Trend is still nicely up but that is a lower low and lower high. An inverse cup and handle.
US:NVDA (Nvidia)
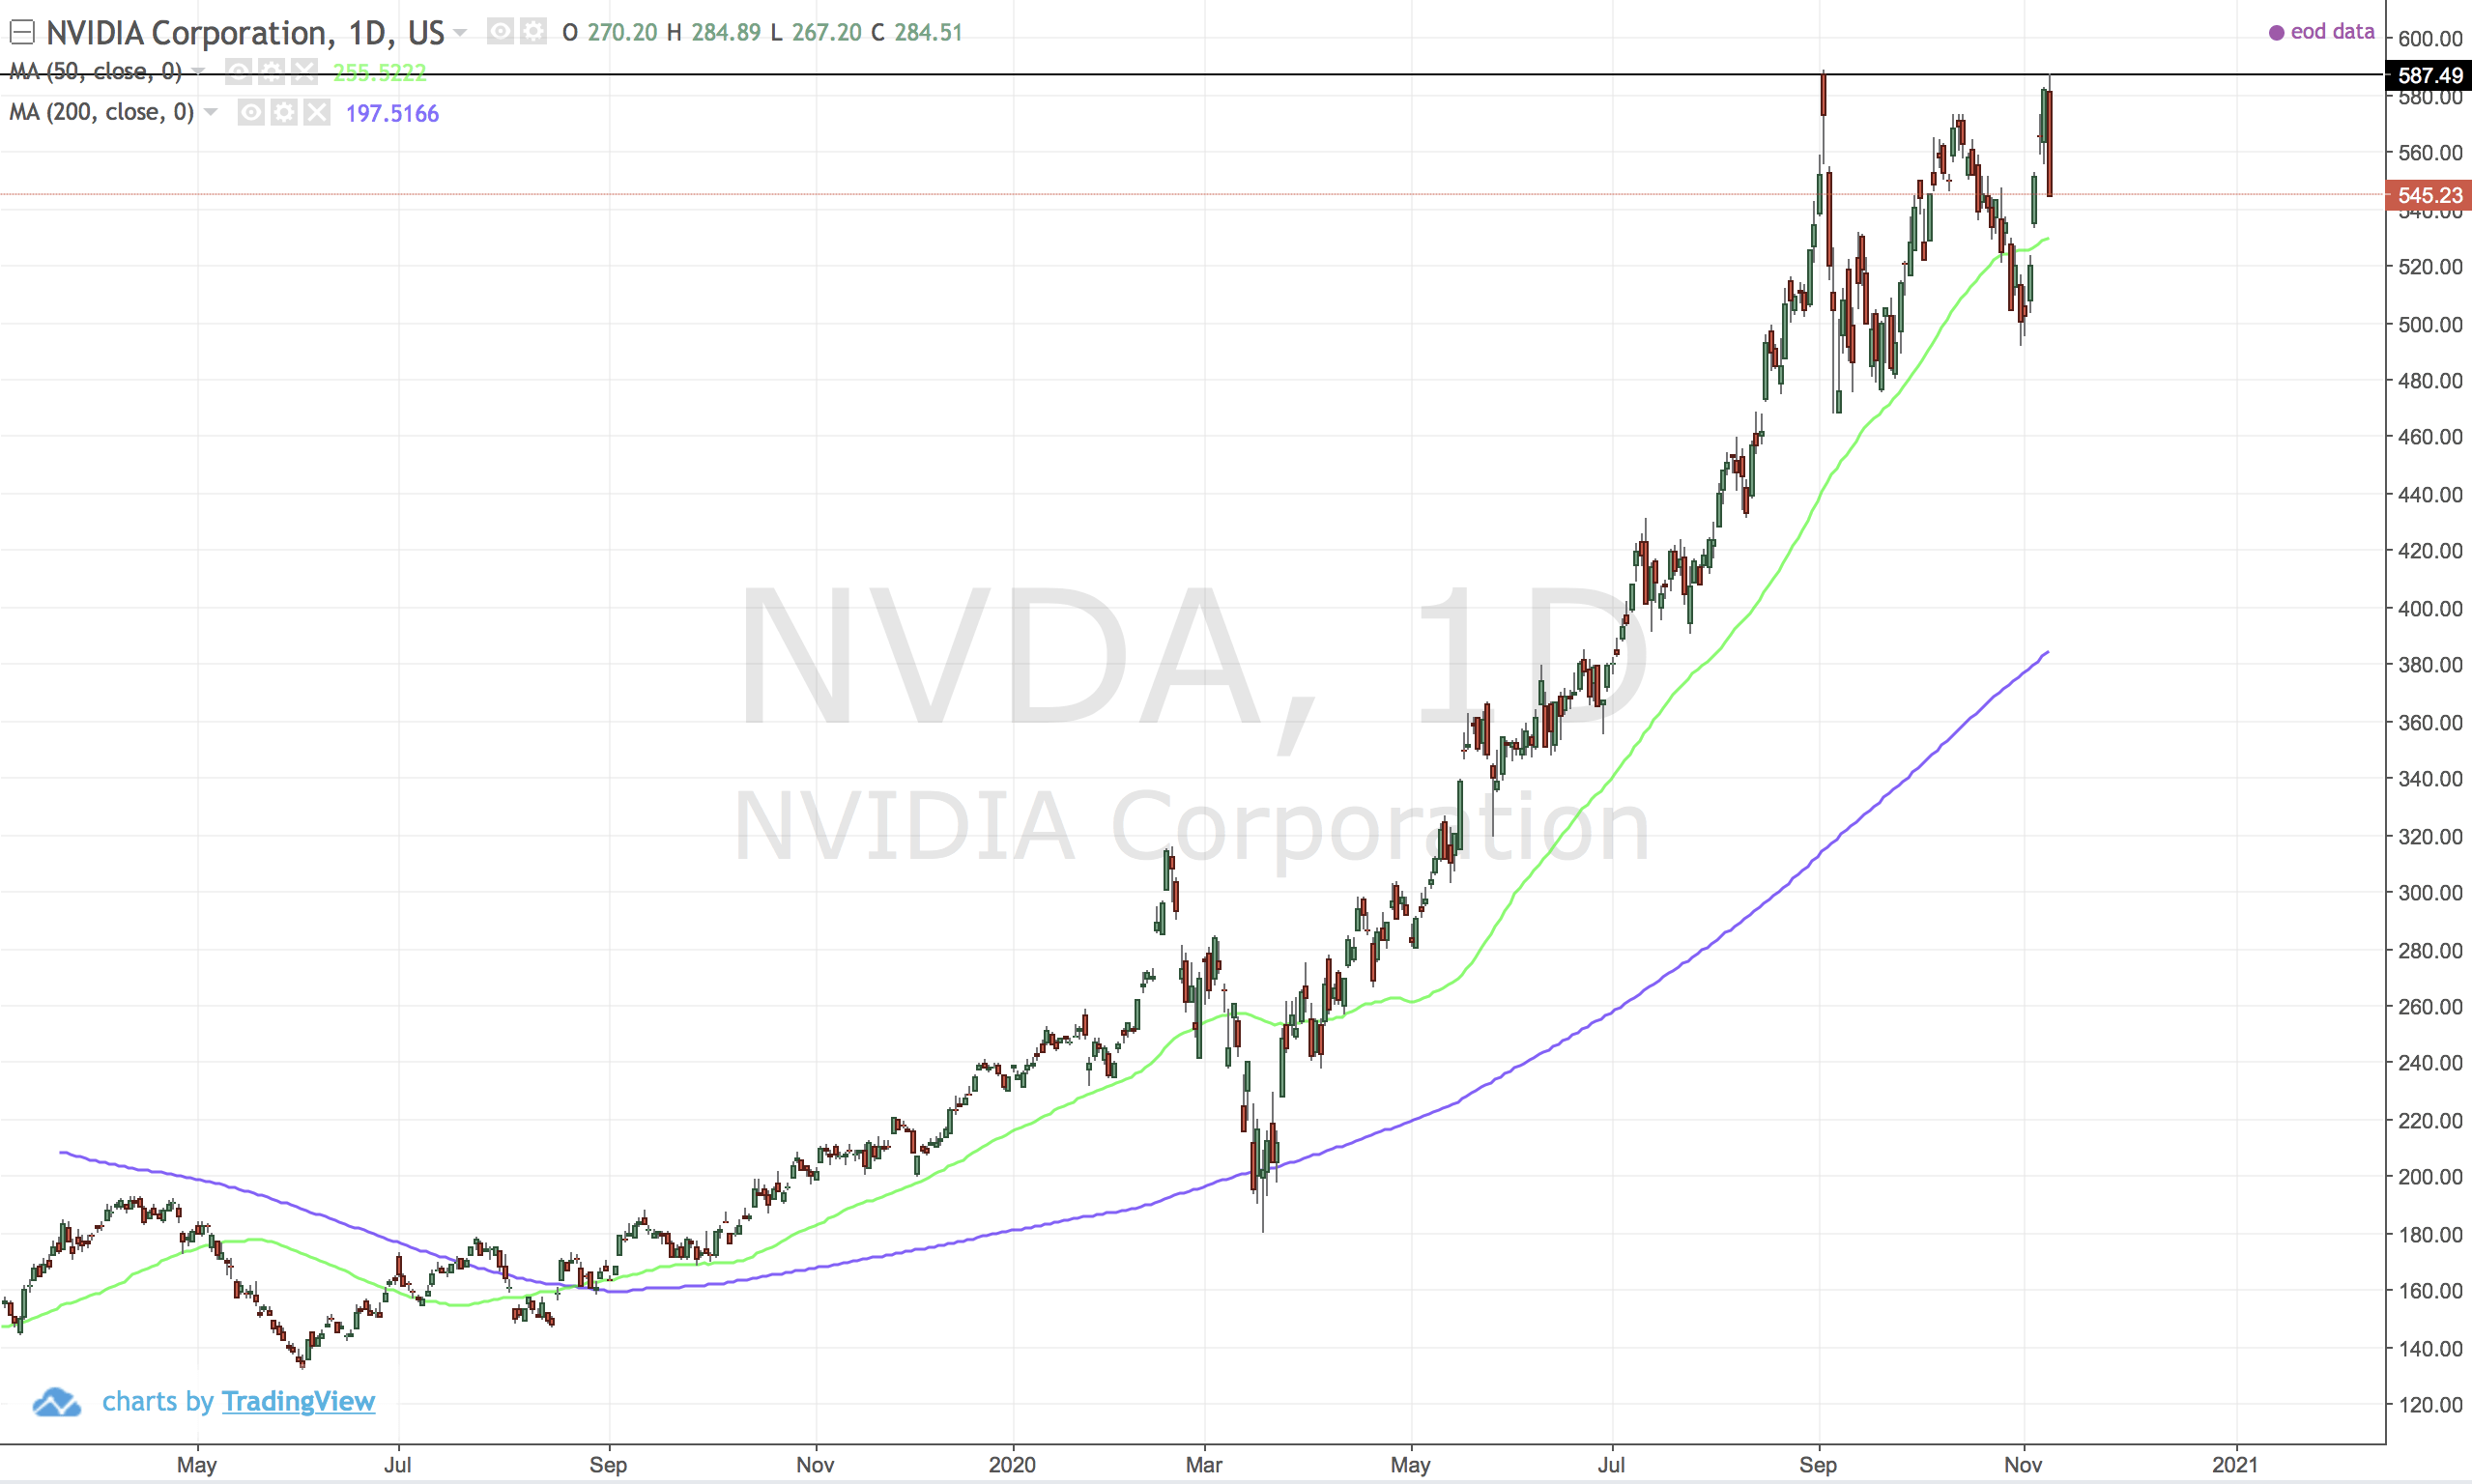
Needs to break above 588. Looking strong overall.


Comments ()