Trendline breakout on Amplats (JSE:AMS)
Village Trader Looks at AMS for a move up

Weekly Chart
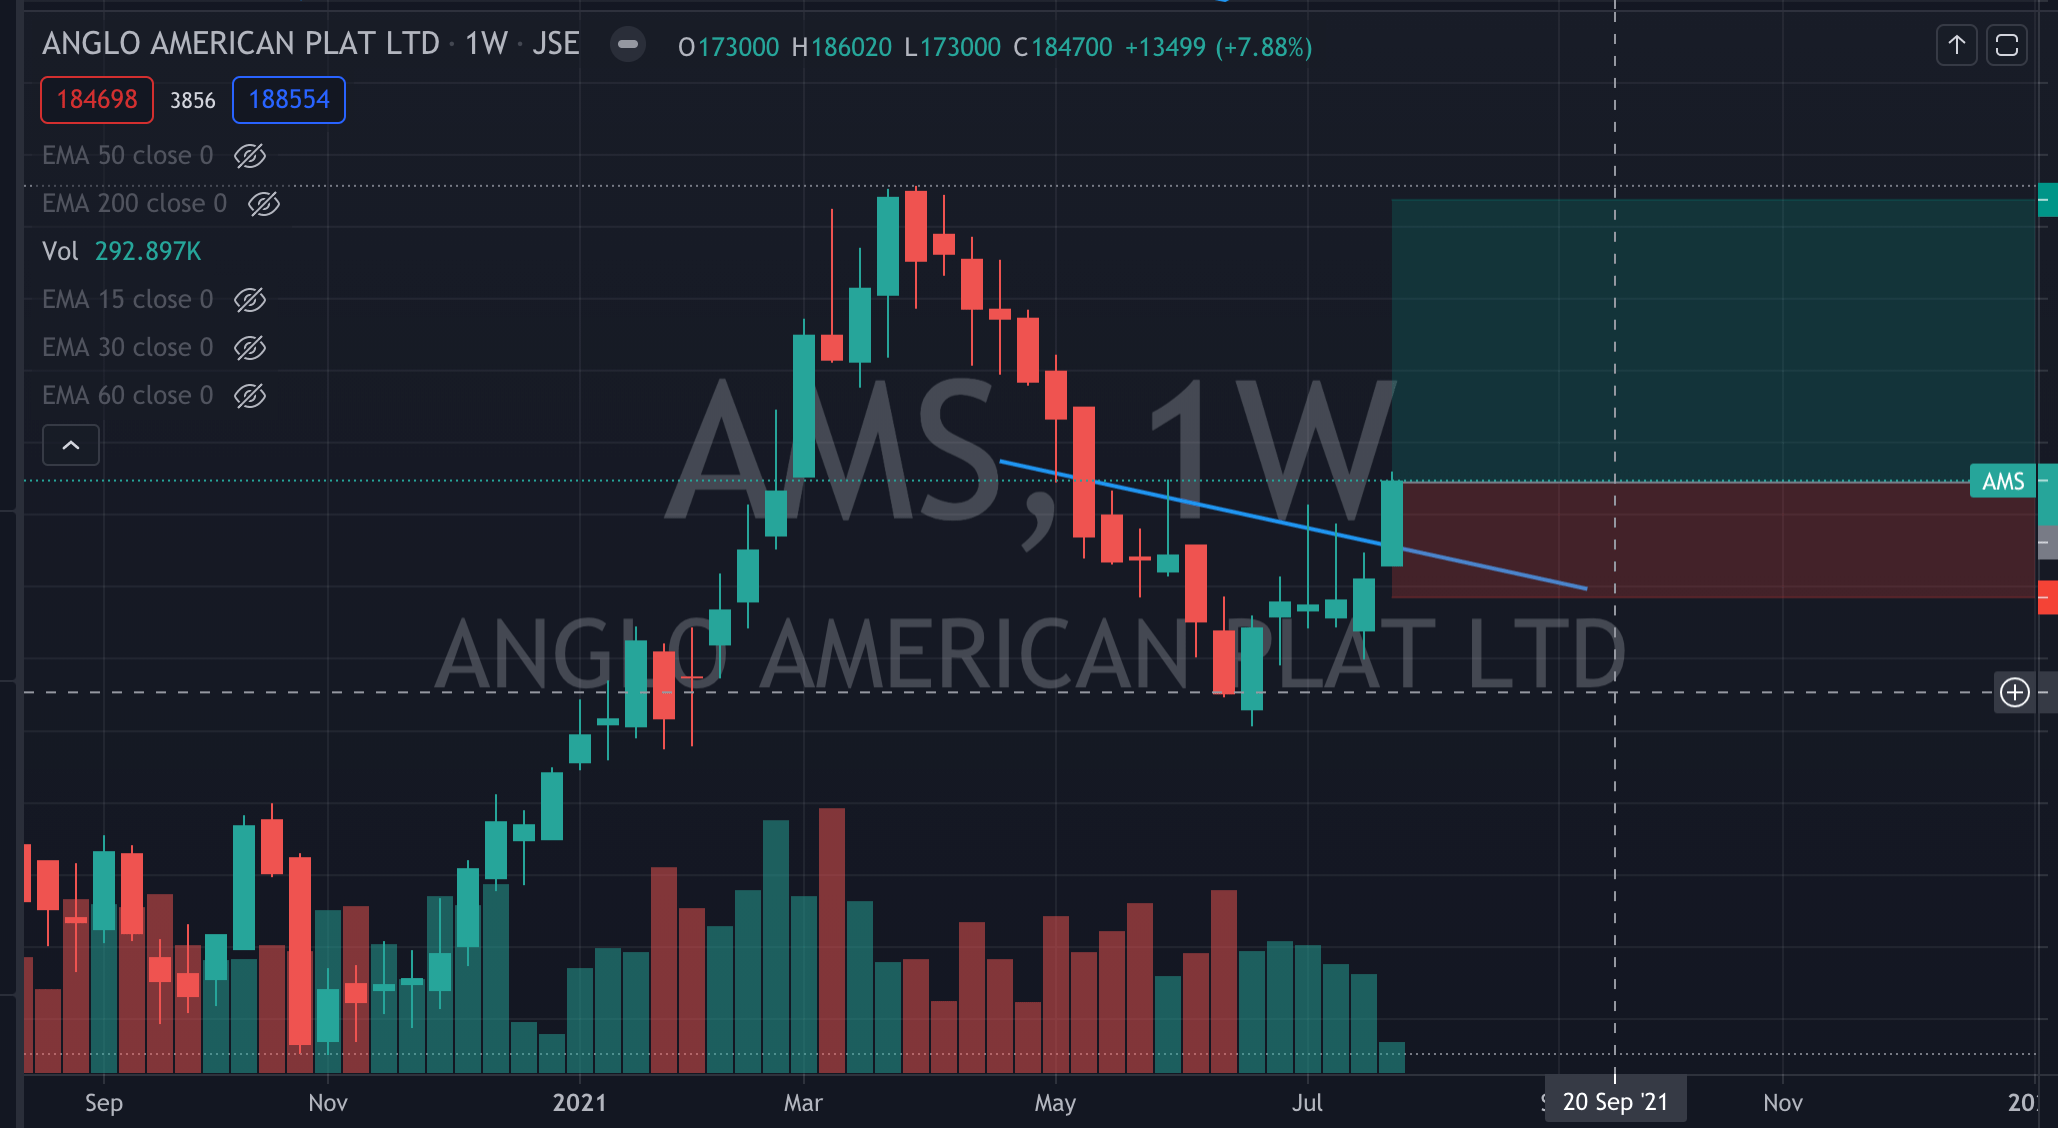
The stock held the R1514 support, also holding the 50 day EMA . We could see the stock run to R2240 (+30%) from current levels. There’s a Head & Shoulders breakout on USDZAR signal potential ZAR weakness coming. Doesn’t hurt that the company is a good dividend payer and the balance sheet is quite strong.
Daily Chart
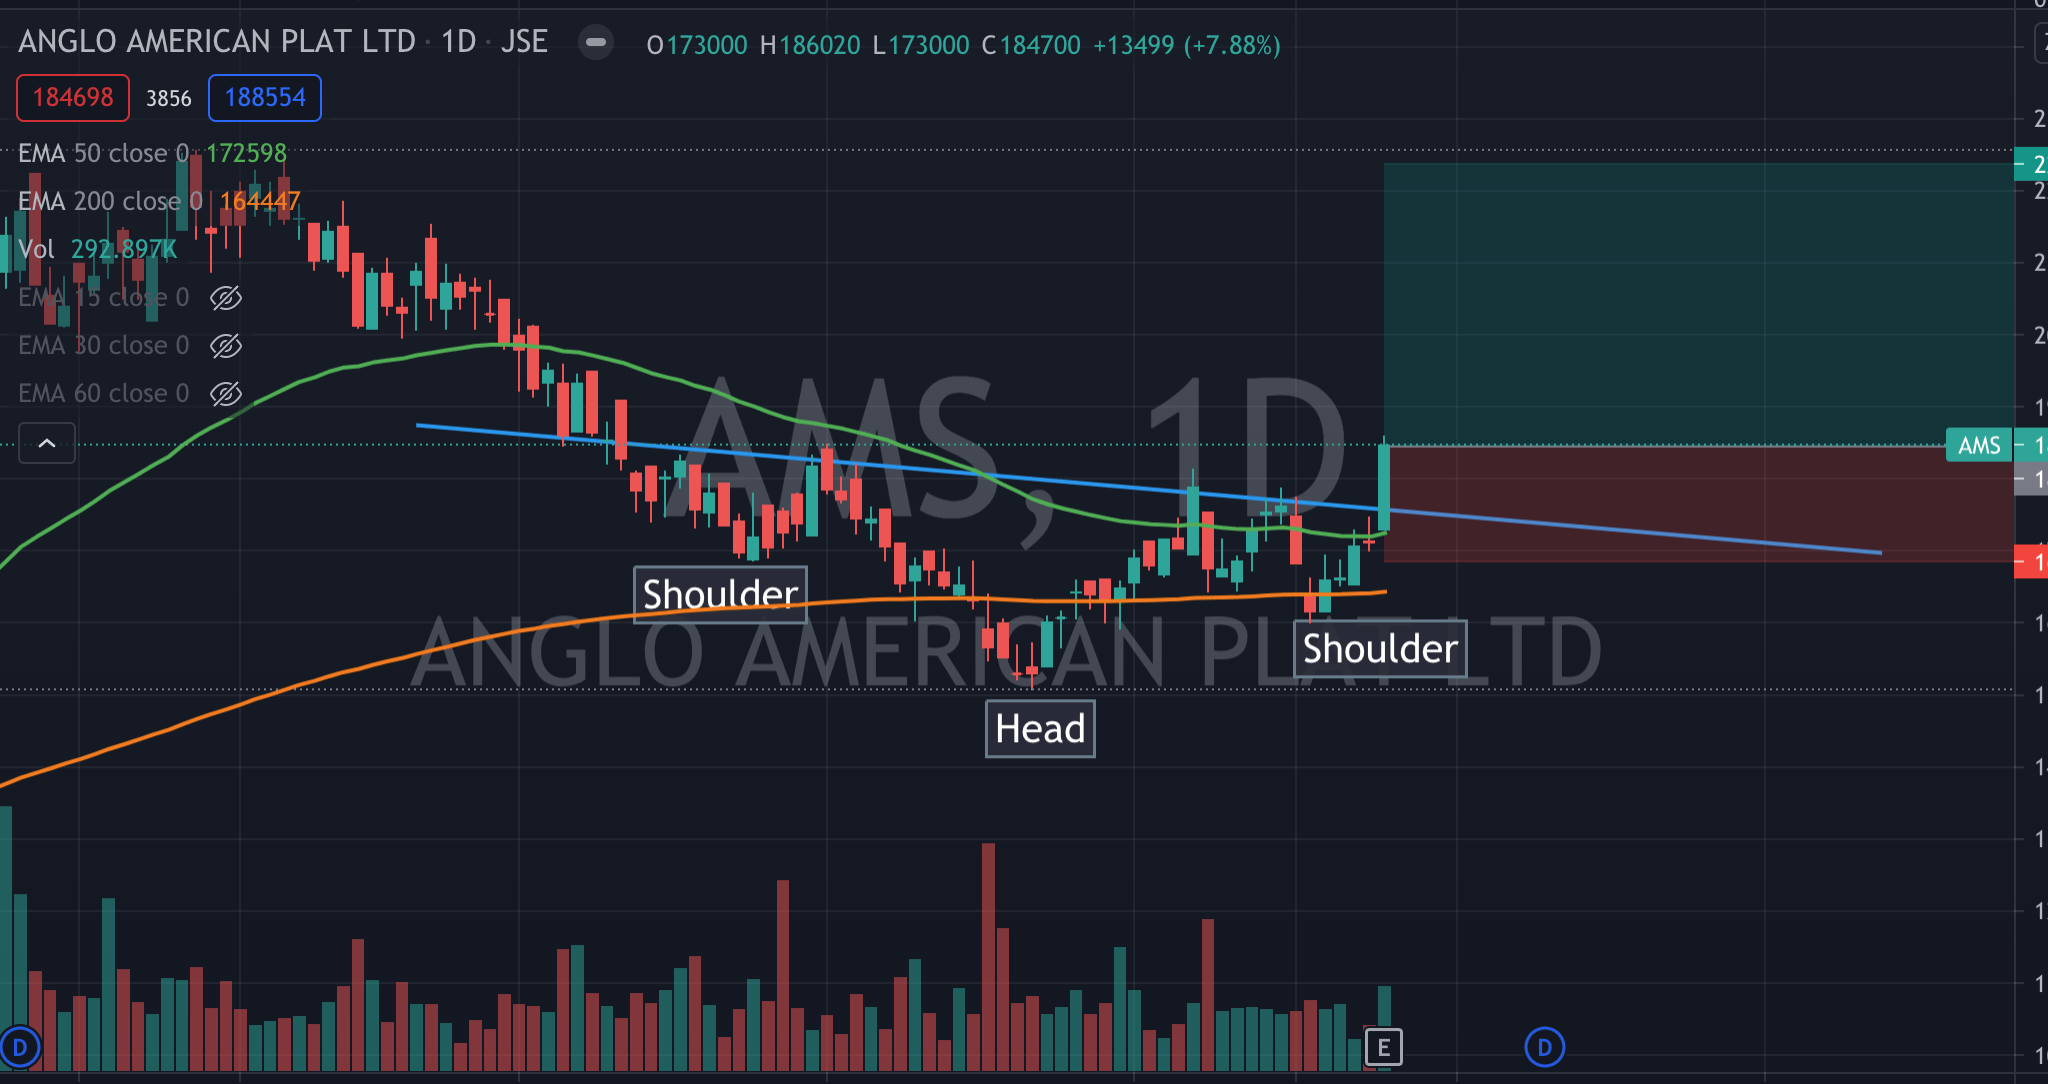
We have a nice inverse H&S pattern as the stock leaves the 200 day and 50 day EMAs behind. The market loving the massive dividend the company declared at interim stage
Comments ()