SSW (Sibanye Stillwater)
Graeme uses stage analysis to look at Sibanye Stillwater (listed on the JSE)


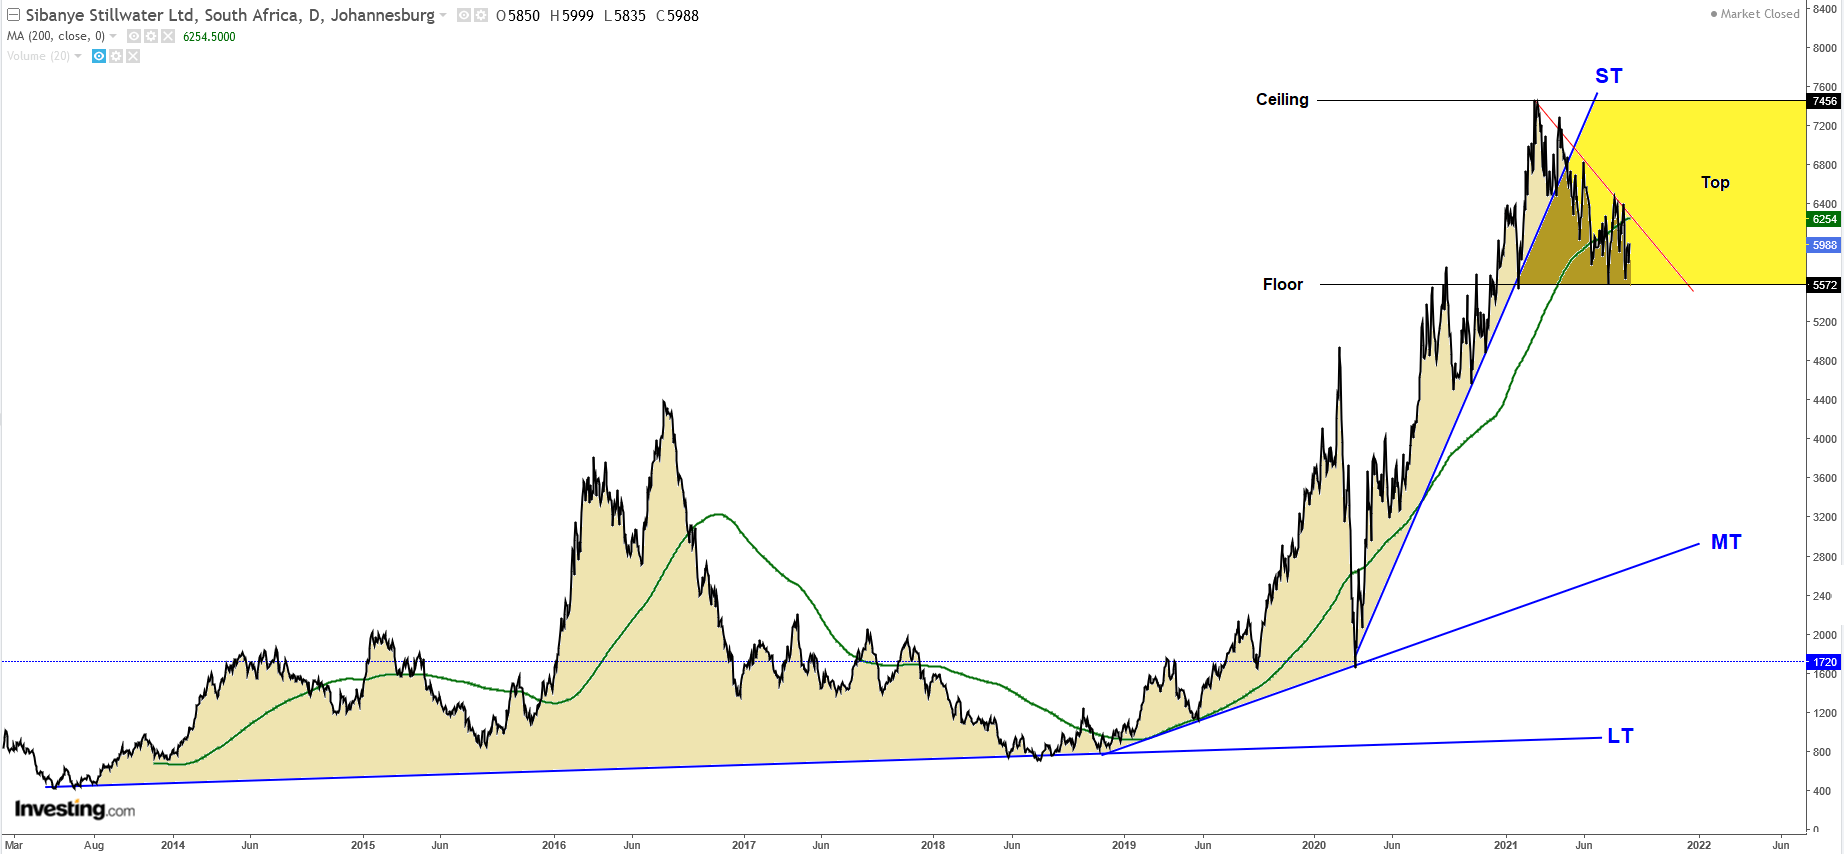
The chart of SSW is sending some strong warning signals. What I love about technical analysis is that it's all sitting there in plain sight for anybody to see who has eyes to see, and yet so few people can see. Let's take a look:
Firstly, the typical stage analysis structure is easily discernible: the Long term trend line, also called stage one, forms the so-called base and is marked here by the line marked LT. That branches up into a stage two advance, aka a medium term advance, marked MT. It then swings up into a short-term advance which is marked here as ST.
Whenever you see a ST advance, you should be wary, because they are by definition so steep as to be unsustainable, which happened here. Once they break, they form a TOP which I have highlighted in yellow. The top is nearly always bounded on the upside by a ceiling resistance level, and on the downside by a floor support level. Breaks of the floor level can be violent and usually spell bad news. SSW is now precipitously close to that floor.
You will also note other warnings: Contained within the top, is a head-and-shoulder pattern, with the neckline defined by the floor level. Further to that, the 200 day moving average has been definitively broken and a clear descending trend, shown in red, is in place.
The rule here is to stay away, unless and until, the upward advance resumes. This will need to be evidenced by it's trading above an accelerating 200ma coupled with an upward break of the ceiling level.
Many fundamentalists are easily fooled by great results, and they ignore these signs. They are then forced into becoming long-term investors.
Read the chart. It tells a story.


Comments ()