KAP - KAP Industrial Holdings
An in-depth look at KAP Industrial Holdings with Graeme's Stage analysis combined with classical charting

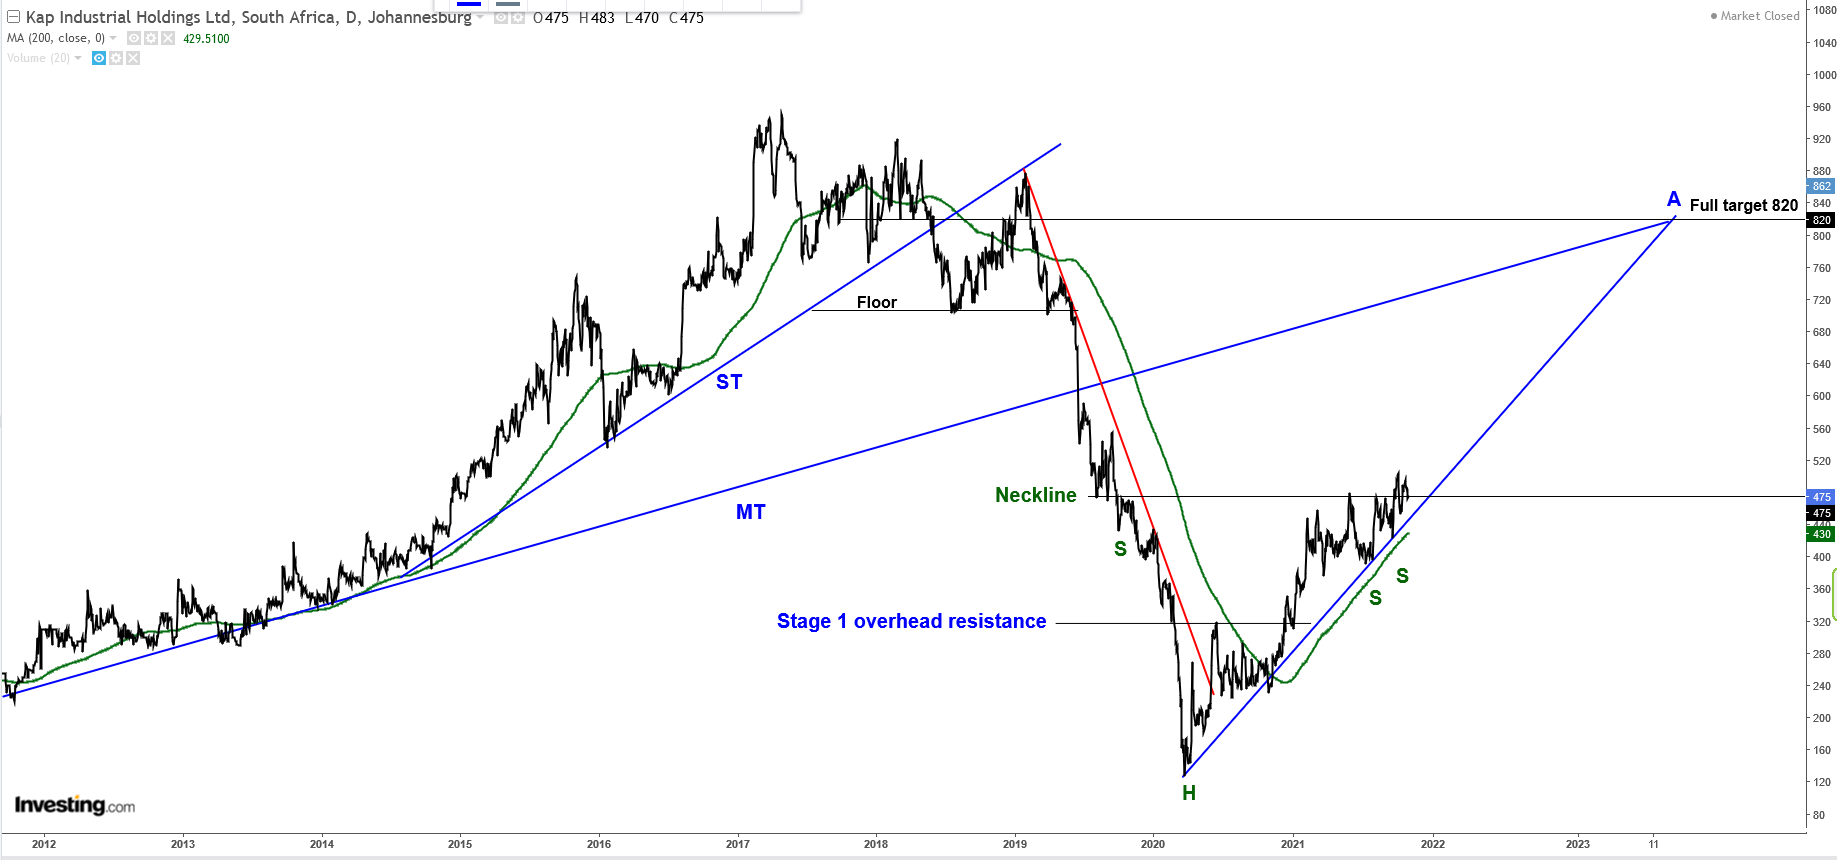
KAP giving us a great example of stage analysis combining with classical charting. We see the MT trend line which branched up into a ST trend, formed a top, and then crashed through the floor into a spectacular stage 4 decline. When the horizontal resistance line above the stage 1 base broke , we had evidence of a new stage 2 advance underway. The new stage 2 trend line projects perfectly to point A, which coincides nicely with the old MT TL. Notice also the inverse head-and-shoulder (S-H-SS) formation, with the neckline in the process of breaking. This sets up a full target at 820, which again coincides precisely with point A.
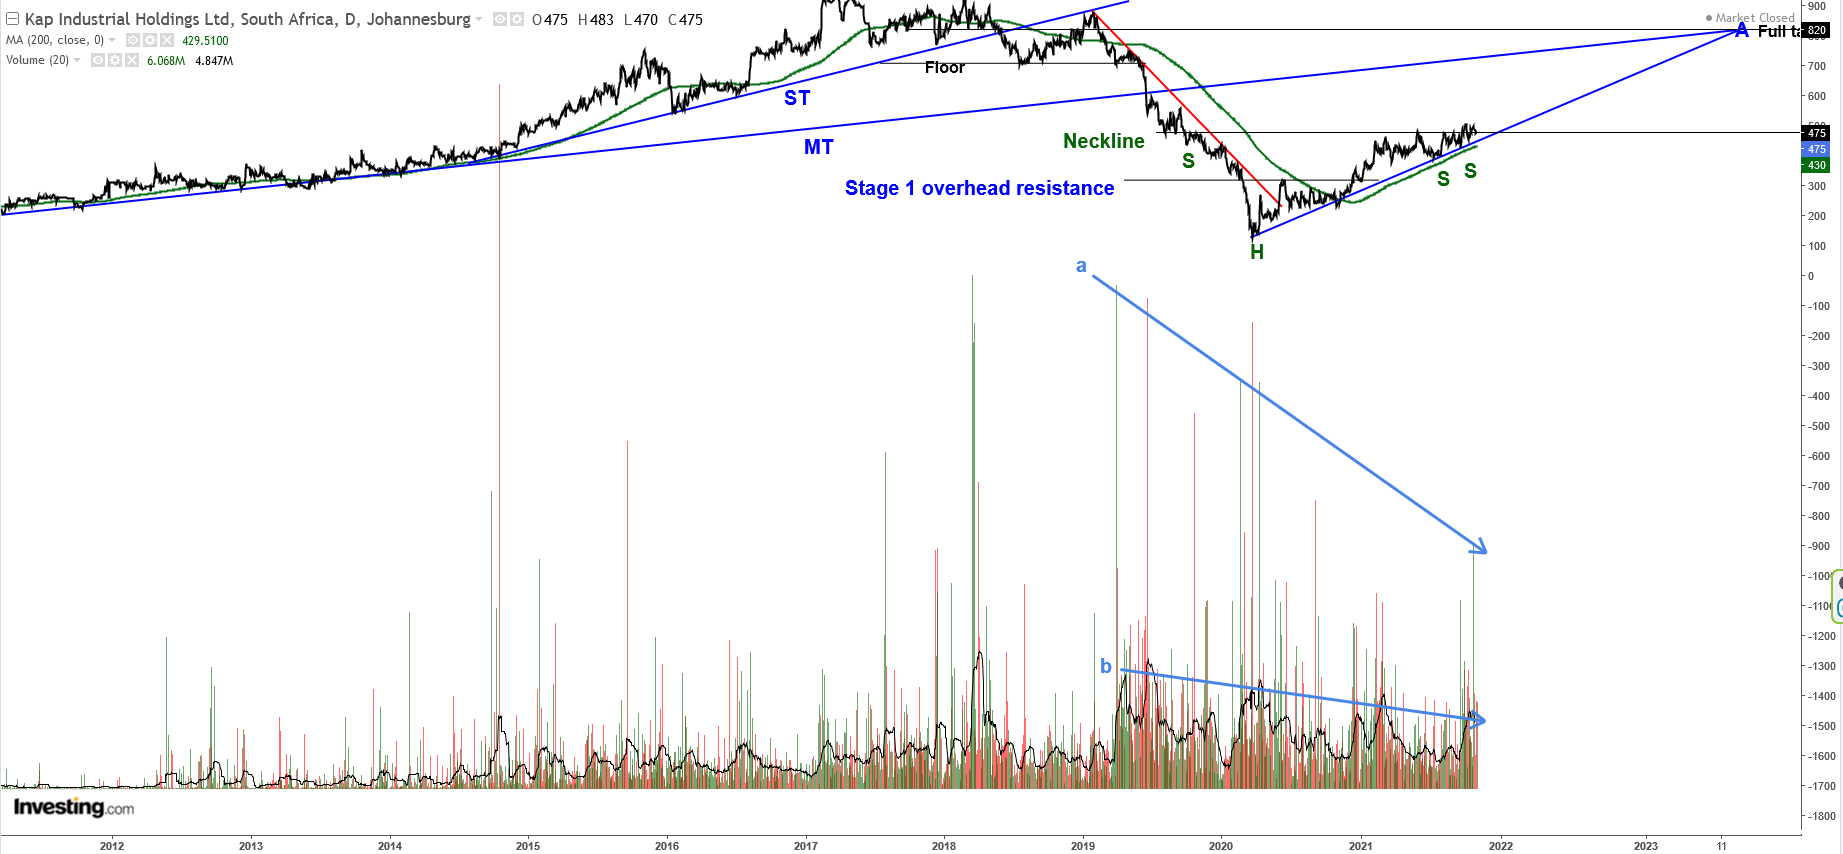
If we dig under the surface a bit, and take a look at volumes, the declining volumes are apparent in both lines (a) - indicative of institutional buying/selling and line (b) indicative of average volumes including retail buying/selling. The volume contraction is a strong indicator of declining 'supply'. In other words, holders of the shares are increasingly hanging onto them. This often precedes a significant upwards move.


Comments ()