Stage Analysis: Imperial Holdings
Stage Analysis of Imperial Holdings including the volatility contraction pattern.

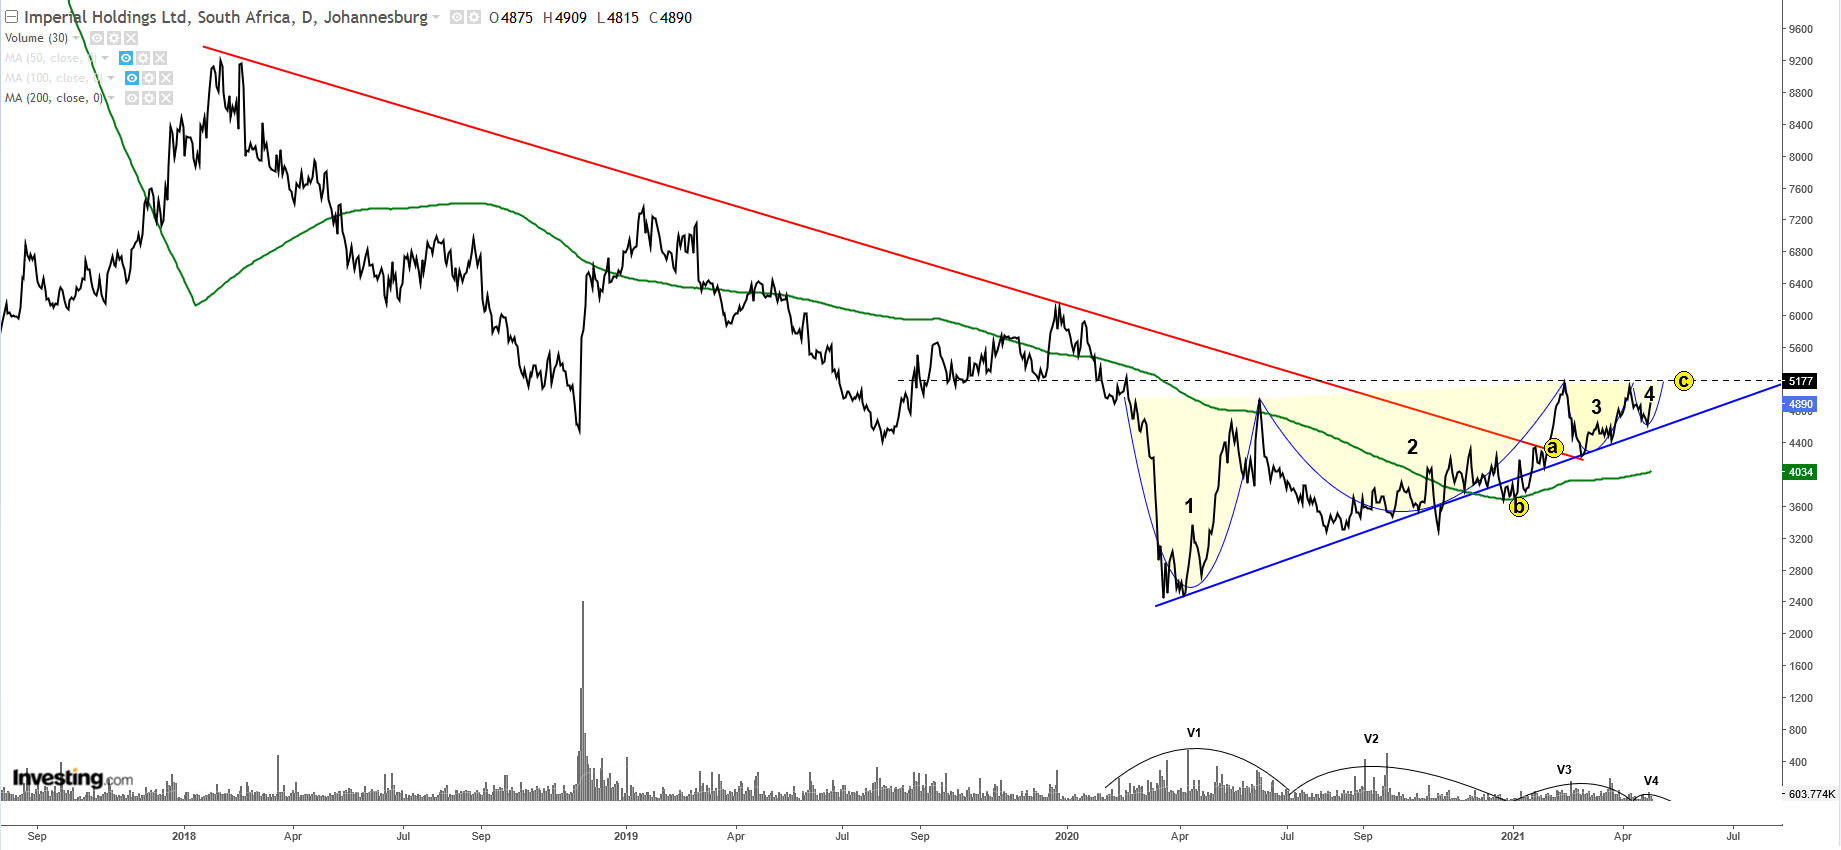
The long (stage 4) descent gave notice of a change in direction at point (a) when the price broke through the red descending trend-line.
This was preceded by a break of the 200 day moving average (200ma) at point (b), which changed direction & started rising.
We now await a break of overhead resistance around point (c) to properly confirm the change into a stage 2 advance.
Note also the "volatility contraction pattern" (VCP) - marked here as 1-2-3-4 and highlighted yellow. These are typically characterized by a series of diminishing loops, that are often followed by an aggressive move once the resistance level breaks (i.e. level (c)). A common identifier of a VCP is the diminishing volume as supply declines - see V1, V2,V3 & V4. Entry would be on the break of level (c) at 5177 ZAC and your stop should be slightly below that.


Comments ()