$Gold XAU/USD
Graeme takes a look at Gold and describes the flag and inverse head and shoulders technical patterns.

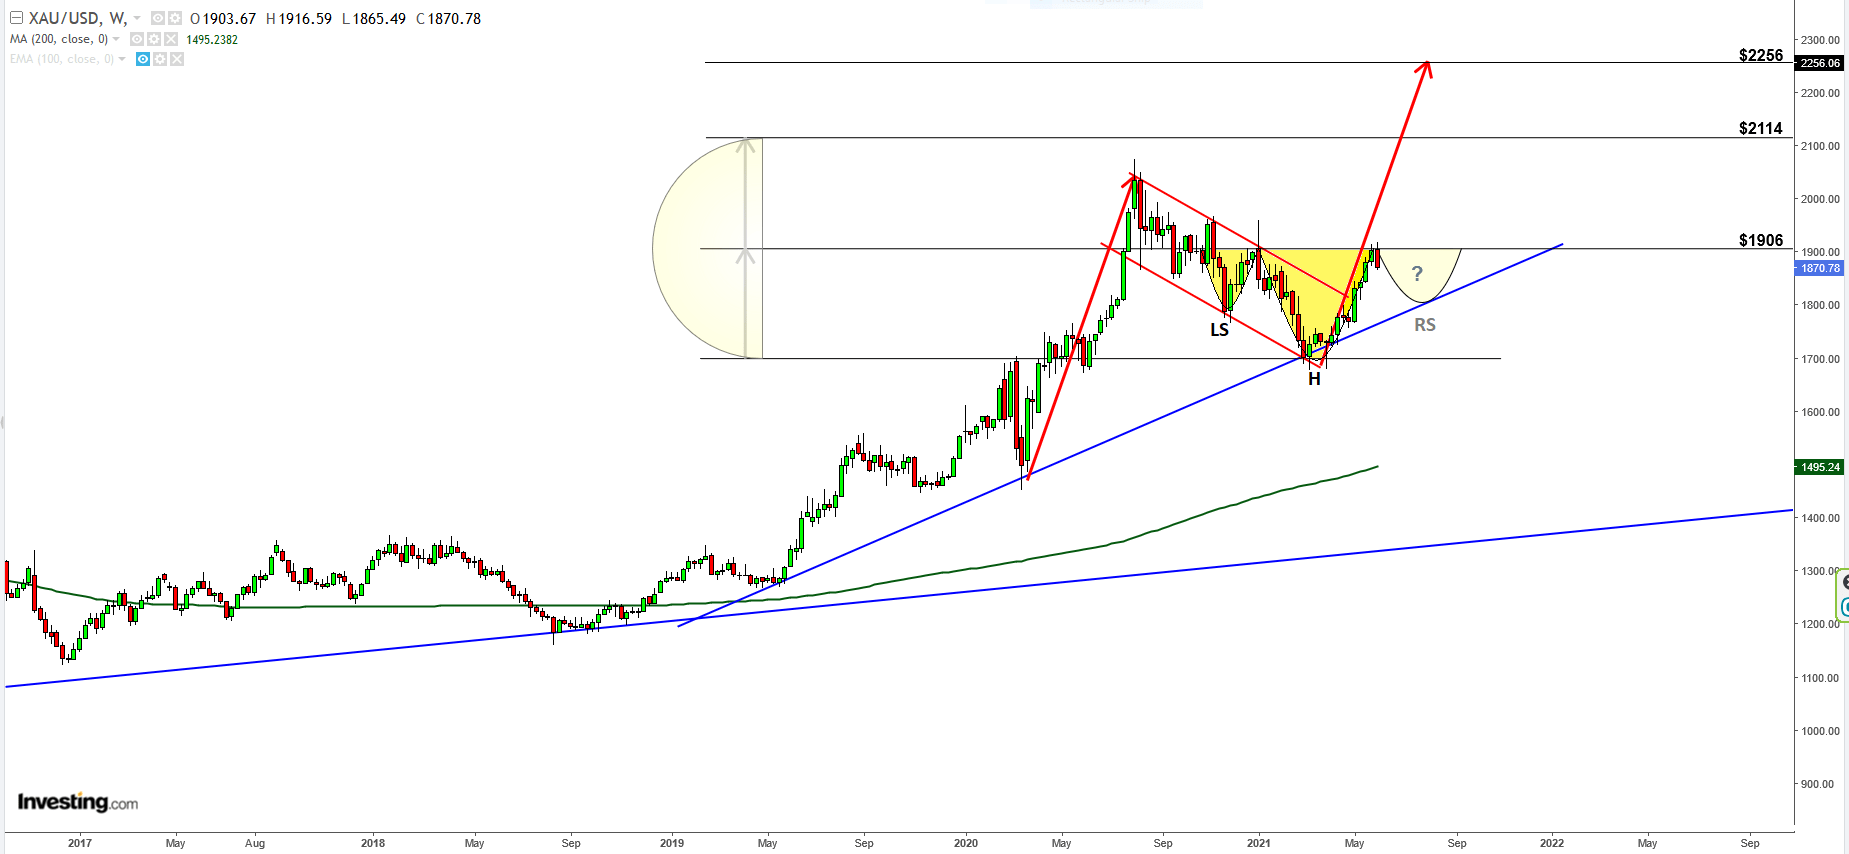
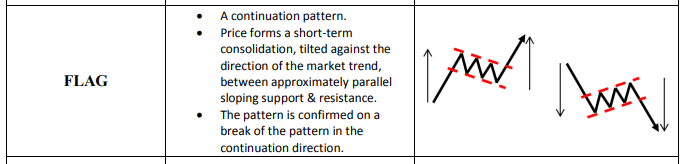
The US$ Gold price recently printed a clear flag pattern which set up a full target price of $2256 - For those unfamiliar with flags, see a brief description below:
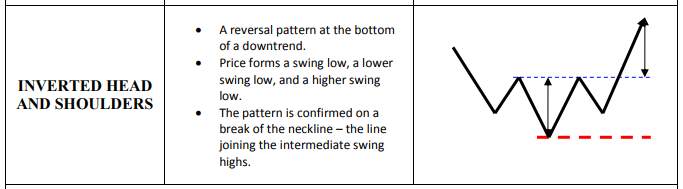
Simultaneously, we also see an Inverse Head-and-Shoulder ("IHS") pattern with the right shoulder in the early stages of formation, potentially targeting $2114. The neckline lies at $1906. Although generally thought of as reversal patterns, they also often play out as continuation patterns, as shown here. IHS described below:
All of this is overlaid on top of a Short term trend-line which began in early 2019. Overall the chart looks very bullish, and completion of the right shoulder with a break of the $1906 neckline would see a double pattern - these usually provide a trader with an extra level of conviction.
An obvious way of playing this on our local market would be a gold ETF, or any of the gold miners. It is also worth noting that the ZAR is looking ever more stretched, and should it turn around, this could add an extra level of acceleration to the local gold price.
Comments ()