AGL - watch for an RSI break?
Graeme looks at Anglo American

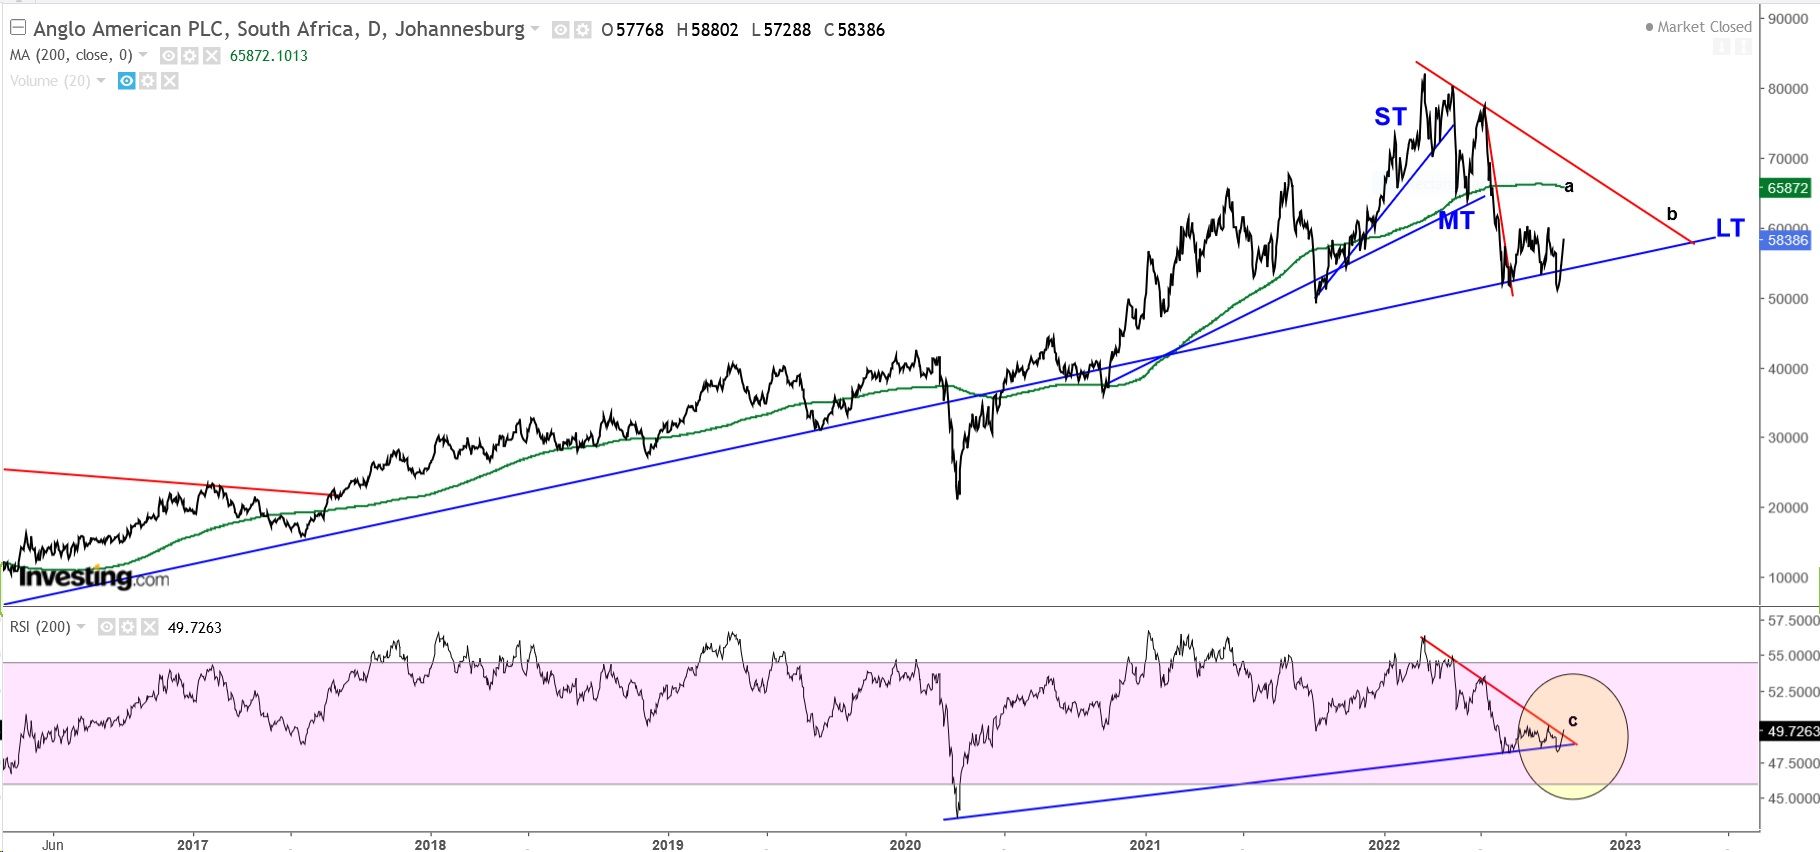
A close examination of the AGL chart shows how the cycle has played out: The ST TL broke, followed closely by the MT TL, resulting in a pullback all the way to the Long Term trend-line (LT TL for short).
We now look for a recovery along the LT TL, and we need to see a break of the 200ma (see point a) as well as an upward break of the descending red TL (see point b). Interestingly, the 200-day RSI is suggesting that a breakout point (could be) close - circled and highlighted (see point c on the lower chart.)


Comments ()