An update on the JSE Top40
An update on the JSE Top 40

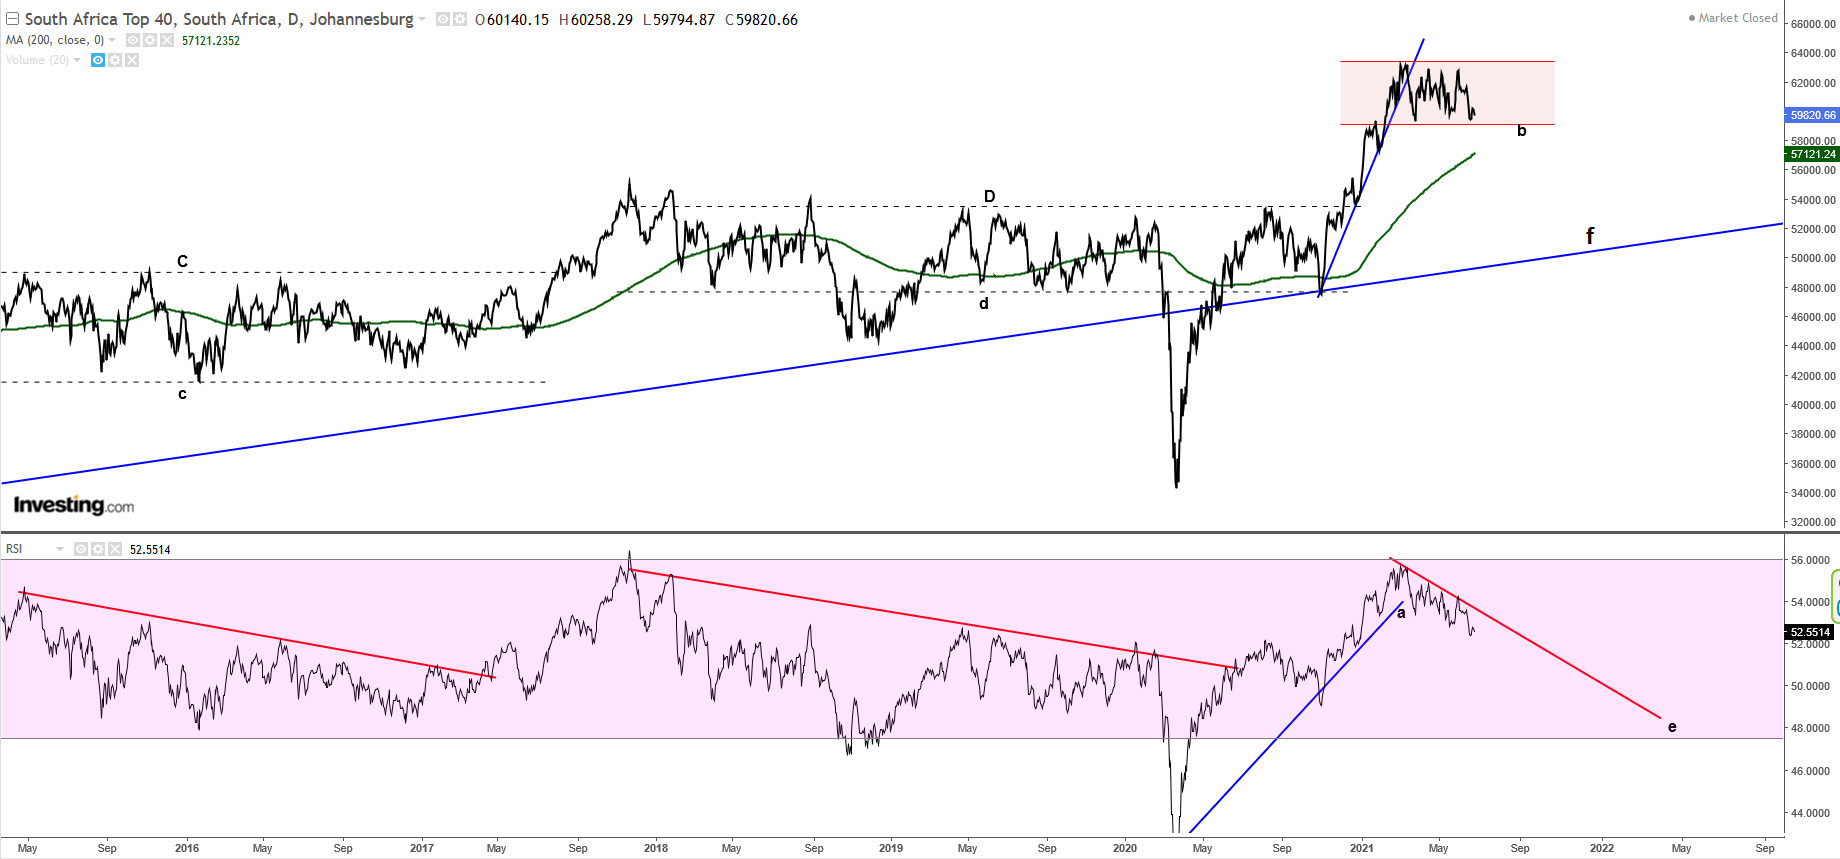
The JSE Top40 appears set for another long period of sideways consolidation such as we saw earlier (see dashed zones marked C-c and D-d).
In each of the previous sideways moves, we saw the long-term RSI trending downwards : take a look at the RSI directly below zones C-c and D-d.
The recent good performance of the Top40 broke down on the RSI at the point marked a, and began a clear descent along the red line marked e.
Referring back to the price chart, this clearly aligns with the area shown in pink, above b, which we describe as a stage 3 top. These most often precede a breakdown (which would likely indicate a move back to the Medium-Term Trend-line, somewhere around f) or else another multi-year sideways consolidation such as we have seen before. This is, in my view, more likely.


Comments ()