A look at the VIX (Volatility Index)
TraderVN looks at the VIX (Volatility Index)

There seems to be quite a bit of interest on this one on social media so I thought I would have a closer look at it.
On a much shorter time frame, it seems that the VIX is nearing lows and this has people panicking about an imminent bounce, and hence a possible market sell-off.
Although this is always a possibility, a zoomed out view shows me something different. We see that the VIX in the past has reached much lower levels and if we combine with the fact that:
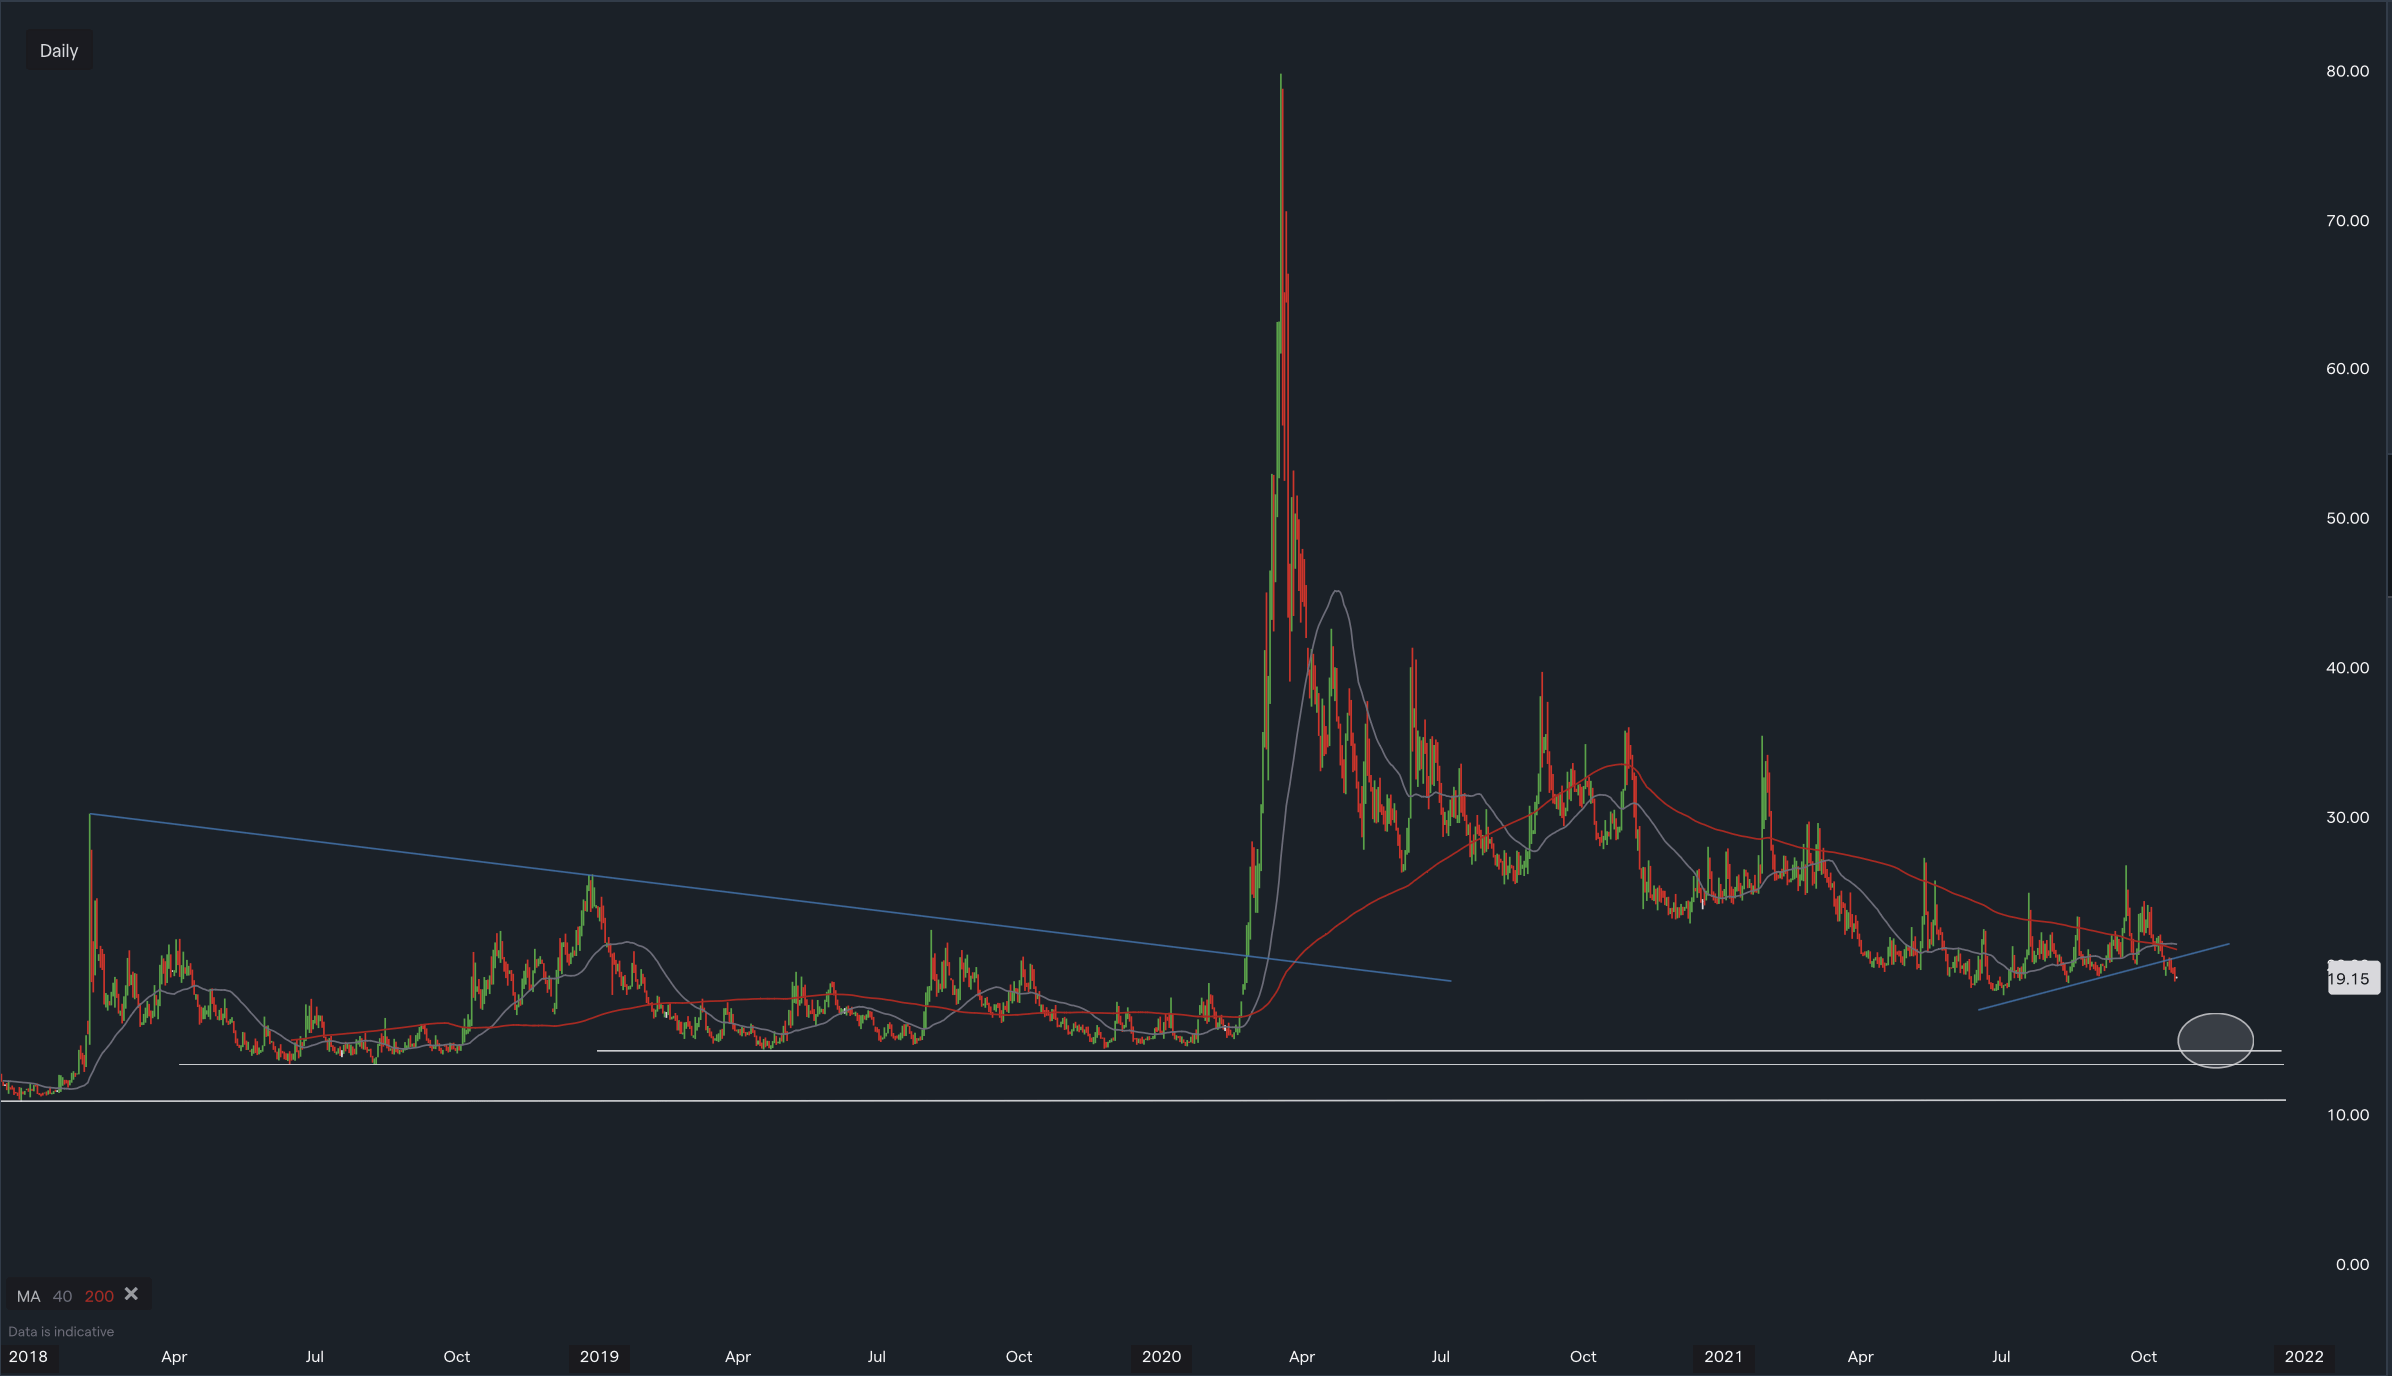
- a) VIX is trading below both its 200 DMA and 40 DMA moving averages
- b) has broken a very short term support level (
Blue TL) then there is a reasonable argument that we could see a follow through of this downside move to possibly the horizontal support (white oval area - 15). I would keep a close eye on this very important index, and if it should indeed move closer to the 15 mark, I would probably hedge my portfolio with a few longs on the VIX.


Comments ()